November 2019, Volume 28, Issue 11, pp 2444–2451|
Biały, M., Adamczyk, W.M., Marczykowski, P. et al. Eur Spine J (2019) 28: 2444.
https://doi.org/10.1007/s00586-019-06016-y
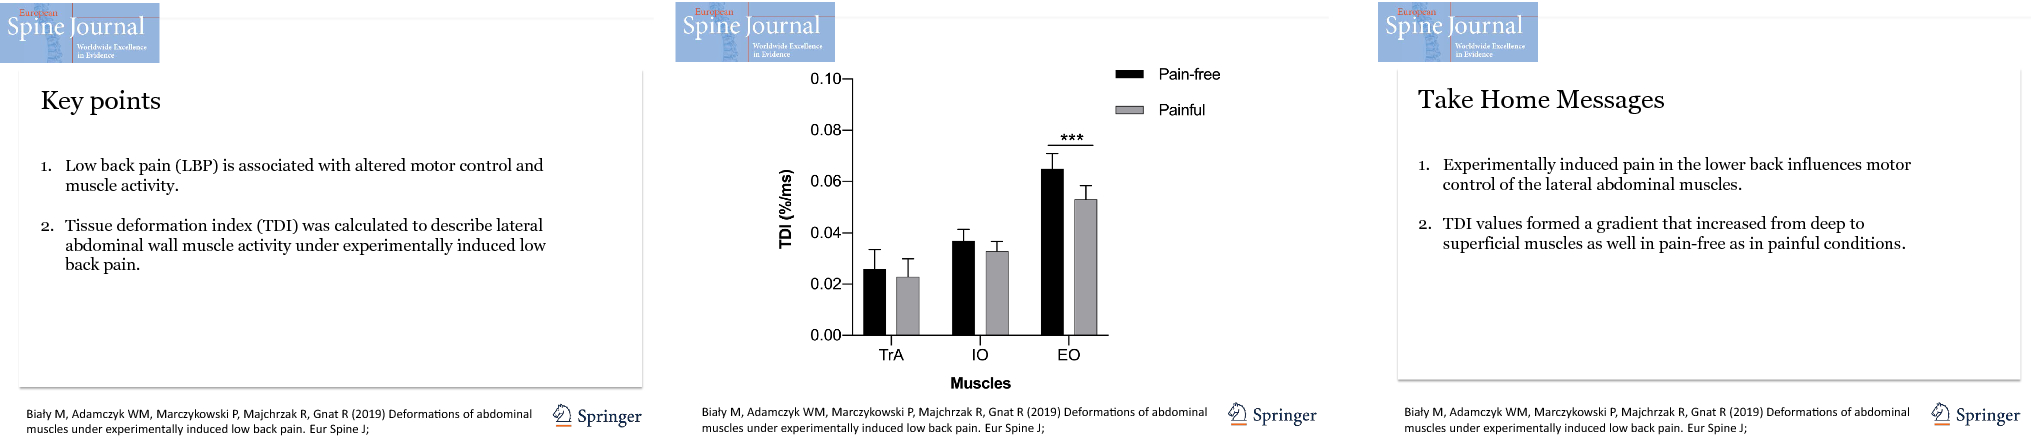
Low back pain (LBP) is associated with altered motor control and muscle activity; however, it remains unknown whether these changes predispose humans to injury and pain or are the consequence of ongoing nociceptive processes. In this experimental study, we aimed to use a novel ultrasound imaging technique for the measurement of lateral abdominal wall muscle activity: the tissue deformation index (TDI).
Forty-two healthy subjects (22.30 ± 1.49 years of age) were exposed to postural perturbation induced by rapid arm movement. Activity of three muscles, the transversus abdominis (TrA) and the internal and external oblique (EO), was recorded by ultrasound imaging (M-mode) with and without induction of LBP. Pain was induced by electrical stimulation applied bilaterally to the lumbar spine.
No significant differences in the TDI between right and left sides of the body (p > 0.05) were found. Generally, muscles deformed slower with pain compared to non-painful conditions; however, only EO muscle displayed a statistically significant reduction in deformation velocity (p ≤ 0.00001). TDI for EO decreased from 0.065% per ms ( ± 0.038, 95% CI 0.057–0.074) to 0.053% per ms ( ± 0.035, 95% CI 0.046–0.061). Furthermore, characteristic inter-muscular TDI gradients were observed, directed from inner towards outer muscular layers, with TrA showing the lowest TDI and EO the highest.
Experimentally induced LBP suppresses deformation of the superficial abdominal muscles and increases the variability of local/deep muscles. Further research is required to confirm these observations.
These slides can be retrieved under Electronic Supplementary Material.
Abdominal muscles Acute low back pain Experimental pain Motor control Ultrasound imaging
The online version of this article ( https://doi.org/10.1007/s00586-019-06016-y) contains supplementary material, which is available to authorized users.
Low back pain (LBP) is associated with altered motor control and muscle activity. A number of studies have shown a link between LBP and delayed muscle onsets [1], lower level of motor variability [2], reduced muscle activation of the trunk, increased stiffness [3], lower muscle force [4], changes in muscles’ voluntary activity [5] and higher-ordered movement capacities, such as gait [6, 7]. Interestingly, although all of these behavioural features have their own underlying physiological changes (e.g. back muscles atrophy, fat infiltration), it is still unknown whether these changes predispose humans to injury and pain or only pose consequences of the ongoing nociceptive processes. One way to disentangle this problem is to fully understand how the motor system responds to acute LBP in an experimental setting. In previous studies on LBP, the role of deep abdominal muscles has been highlighted, especially the role of transversus abdominis (TrA) and inert parts of internal oblique (IO) muscles [8]. Some studies have shown that activation of these muscles is reduced in LBP [8, 9], while other reported contrary results [10]. Nevertheless, there is a consensus related to the difference between patients with back pain and healthy controls, suggesting that people change the way they move during painful events [11]. It has been suggested that contemporary models of movement alterations in pain are not consistently supported by the evidence, which leads to different conclusions in research reports [11]. For example, Lund’s adaptation to pain theory assumes that some motor units are inhibited in pain, i.e. these related to the source of nociception, while those units responsible for innervation of antagonistic muscles reveal enhancement in activity [12]. Although this model has been widely accepted, there are studies which either confirm or disconfirm it (see [11] for review). The second theory, the vicious circle theory, states that pain produces stereotypic responses of increased muscle activation, which leads to stiffness, ischaemia and subsequent painful events [13]. Recently, Hodges and Tucker [11] questioned both theories and argued that both concepts are too simple to explain huge variability in motor responses to nociception at micro and macro level. They argued that new theory should explain motor behaviour change in terms of protection to the body. In this experimental study, we aimed to further investigate motor control mechanisms of lateral abdominal wall muscles (LAMs) in acute LBP by using a novel ultrasound (US) method for the measurement of muscle activity: a tissue deformation index (TDI). This new method measures velocity of muscle deformation during motor tasks and recently has been shown to be reliable and valid [14]. The aim of this study was to investigate TDI changes during LAMs activation under experimentally induced pain. Since abdominal muscles are important from the perspective of lumbar spine function, the ultimate goal of this study was to provide evidence supporting theories regarding the influence of pain on motor control patterns of the above-mentioned musculature.
Out of 53 volunteers who answered our recruiting announcement, 48 subjects were qualified (19 women). Participants were excluded if they reported any of the following: (1) history of serious pain and injury within the lumbo-pelvic area and lower limbs (requiring medical assistance of at least 2-week duration; n = 2), (2) history of any surgical intervention, pain or functional limitations within the upper limbs, or exercise training engaging lumbar and abdominal musculature (Pilates, yoga, Tai Chi, Australian approach, etc.) two months prior to the measurement (n = 2), (3) pain or other minor bodily symptoms (e.g. headache, post-exercise fatigue, cold, etc.) on examination day (n = 1). After data collection, image quality was initially screened by a third independent person (a qualified physiotherapist). As a result, images from 6 subjects were disqualified due to movement-induced artefacts in the tissue echogenicity, leading to inaccurate discrimination between fascial/muscle tissue. Finally, data were analysed from 42 subjects (16 women) characterized by a mean age of 22.30 ± 1.49 years, body height of 177.16 ± 7.30 cm, body mass of 71.76 ± 10.66 kg and BMI of 22.75 ± 2.16 (Table 1). The research was approved by the local Bioethical Committee (No. 5/2011), and all subjects signed written informed consent according to Helsinki Declaration before participation in this experiment.Table 1
Demographic characteristics of the enrolled subjects (N = 42)
| Variable | |
|---|---|
| Male/female ratio | 16:26 |
| Patient age (years)a | 22.30 ± 1.49 |
| Height (m)a | 177.16 ± 7.30 |
| Weight (kg)a | 71.76 ± 10.66 |
| Body mass index (kg/m2)a | 22.75 ± 2.16 |
aValues expressed as mean ± standard deviation
Two raters who were blinded to the objective of the study were involved in the data collection. The raters underwent a 4-week training in ultrasound (US) LAM measurement (3 h, 3 times a week). This training was guided by an experienced specialist (author and principal investigator in the several projects using US measurements) who was not directly involved in the study. While one of the raters was operating the array, the second was responsible for recording the US images (tasks were randomly assigned). Afterwards one of the raters performed the data readout from the recorded US images. In addition, the third person involved in the study supervised the procedure, recruited subjects, screened them against the selection criteria and encoded the US images. (All images were blinded to the rater performing the readout.)
A Mindray DP 6600 US imaging device (Mindray, Shenzhen, China) equipped with a linear array (frequency range 5–10 MHz) was used in the measurements. The images were obtained at a frequency of 5 MHz, as was recommended for LAMs measurements [15-17]. In order to localize the optimal site for LAMs, imaging B-mode was engaged. Then, the device was switched to M-mode, and the final image of the LAMs was recorded in JPG format [14, 17, 18].
Using this method, we evaluated activation of the LAMs in response to postural perturbation in the form of rapid arm abduction with a weight of 3 kg held in the subject’s hand, triggered by an auditory stimulus [19]; this was performed with and without induction of experimental pain. The abduction movement was chosen for two reasons: (1) during the pilot study, the images recorded during arm abduction were less susceptible to graphical distortions, and (2) non-rotation movement acts on the trunk during arm abduction; this movement, present during arm flexion/extension, in large part is parallel to the direction of LAM fibres (especially TrA) and may introduce movement-direction-dependent changes in the activation pattern [20].
The subjects assumed an erect position, with their feet 23 cm apart, sight fixed on a point marked on the wall and arms at their sides. With the US array positioned horizontally [21], one rater identified the optimal location for LAM imaging. Starting from the navel, he gradually moved the array in the lateral direction until the desired image of the three layers of the LAMs appeared on the screen [17]. The optimal array location was marked on the skin with a piece of elastic tape (attached freely, without any strain) with an opening matching the array shape. If necessary, the array’s position could have been reproduced easily. Subsequently, the US device was switched to M-mode. Each subject took one 3 kg weight in one hand and performed three preparatory repetitions of the rapid arm abduction up to 90°, triggered by an auditory stimulus in the earphones worn by the subjects. The use of this type of stimulus was necessary in order to synchronize the movement with the start of US image recording. Also, earphones reduced the risk of detecting other interfering sounds from the environment. If no problem was met and the image quality was acceptable, the ‘true’ recording was initiated. The second rater then gave the command, ‘get ready’ to the subjects. The auditory stimulus occurred every 2–6 s (in a random order) after that. Six repetitions of arm abduction were performed, and six M-mode US images were gathered. This constituted series 1 of the measurements. After a 5-min rest, an identical series (called series 2) with experimentally induced pain was started. For technical reasons, LAMs contralateral to the moving arm were imaged [22]. The side of the body on which the measurements began was randomized. The described methodology is a modified version of the procedures published by other authors [22-25]. The modifications included: stimulus type (auditory vs. Visual), arm movement direction (abduction vs. Flexion) and initial incorporation of B-mode US to localize the optimal site for LAM imaging. The measurements were conducted in a laboratory under standardized environmental conditions. Reliability of the described method was previously reported as good to excellent (intraclass correlation coefficient values for LAMs’ TDI were: TrA: 0.81, IO: 0.88 and EO: 0.87) [14].
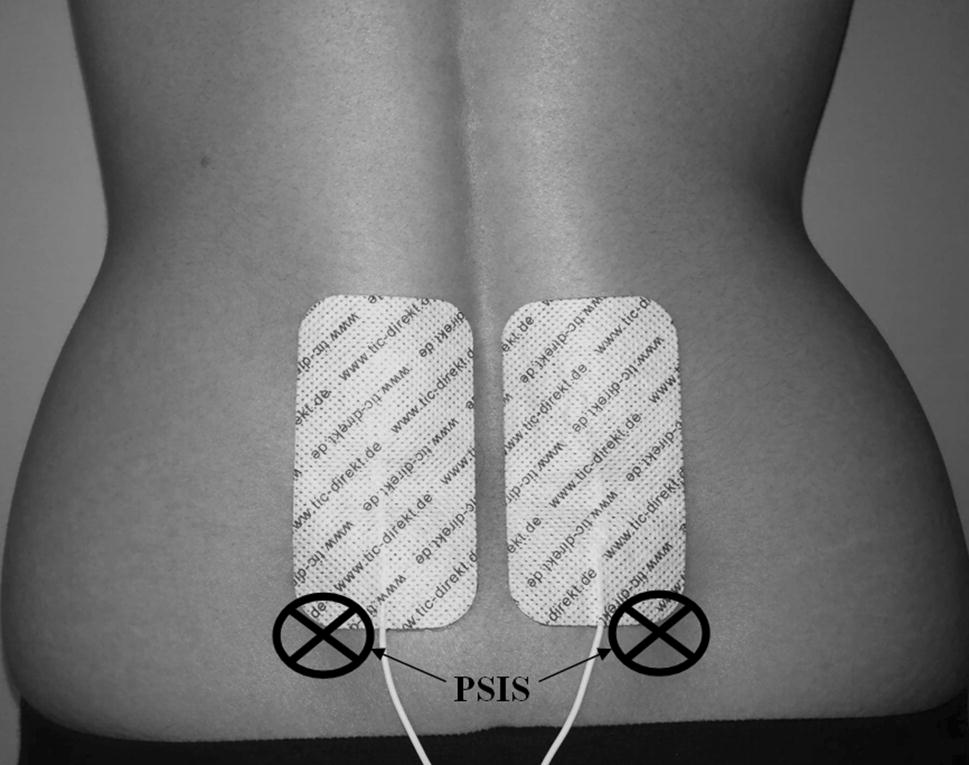
Pain was induced using a Transcutaneous Electrical Nerve Stimulator (frequency 120 Hz, impulse width 15–250 μs) modulated sinusoidally to avoid receptors’ adaptation. Stimulation was delivered through two adhesive electrodes (5 × 10 cm) attached bilaterally to the lower back (above the posterior iliac spines, Fig. 1) where patients with LBP typically experience their pain [26]. To ensure equal intensity of experienced pain, the level of stimulation was individually calibrated prior to postural disturbance according to method of limits [27, 28]. Thus, the level of stimulation was gradually increased (in mA units) until participants reported moderate pain intensity corresponding to the score of 60% on the Visual Analogue Scale [29]. Participants were thoroughly instructed that stimulation might be manifested by itching, scratching, burning or stinging, but their task was only to evaluate their personal pain perception, not other sensory experiences. They were also informed about the scale anchors, with ‘0’ standing for no pain at all and ‘100’ for the worst pain imaginable. During postural disturbance, pain intensity was set at 60%. The painful stimulation was immediately released after finishing the US data collection. No adverse events were reported.
In total, 24 US images of the LAMs were gathered from each subject (12 each from series 1 and 2). These were screened for image quality by a third person. The two images of lowest quality were excluded from each of body site in series 1 and 2. Thus, a total of sixteen images from each subject (two series of 8 images) were ultimately subjected to analysis. To reduce bias, the names of the qualified images were encoded. The images were transferred to a PC computer and analysed using Photoshop 8.0 software (Adobe, San José, USA). The contrast ( + 75%) and zoom ( × 10) of the images were adjusted. Then, using Photoshop tools, the following measurements were taken for each of the LAMs (TrA, IO, EO): muscle thickness at rest, muscle thickness at the point of maximal activation (both along the y-axis of the image) and time to achieve maximal activation (along the x-axis of the image; Fig. 2). Both image axes were scaled so as to offer accurate information about time and spatial parameters.
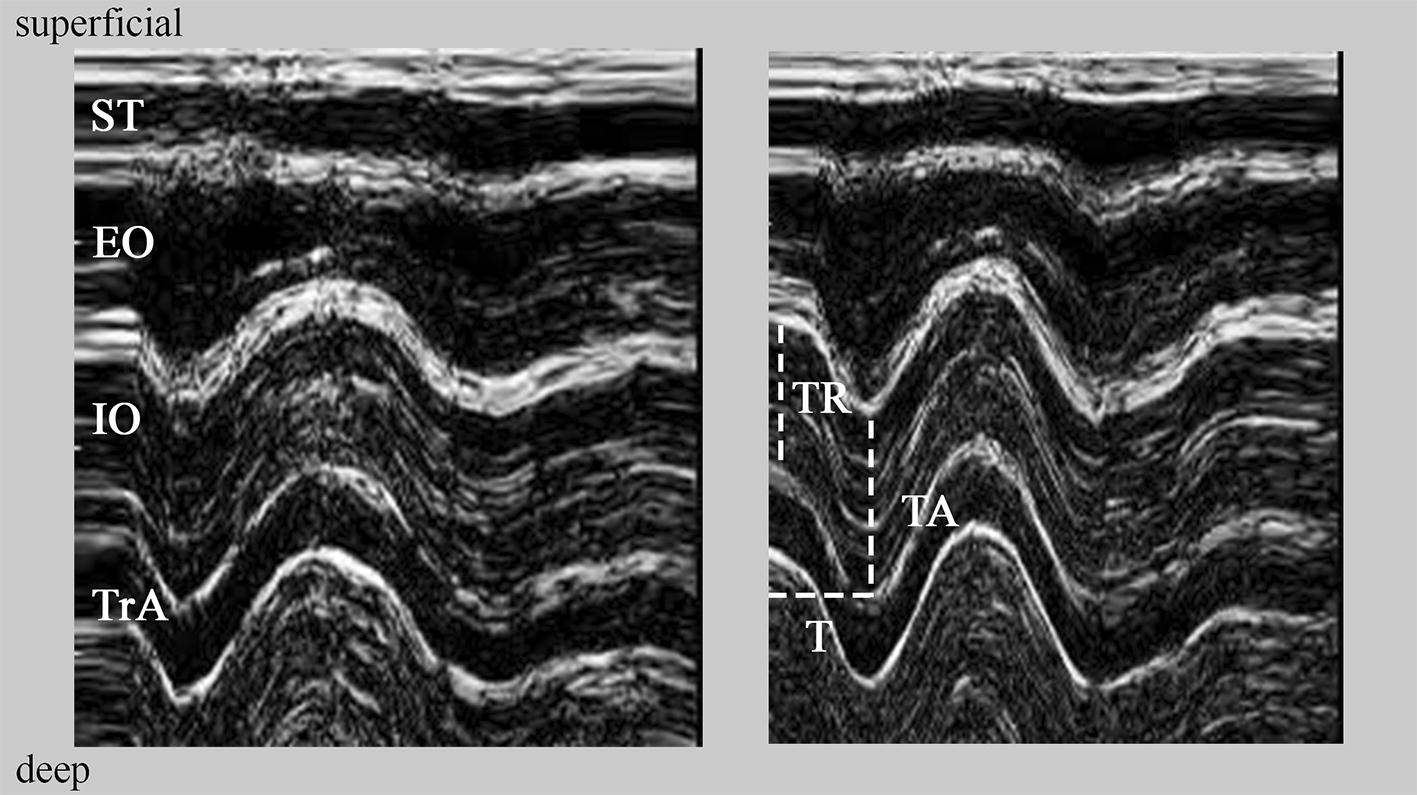
Based on the three mentioned measurements, the TDI was calculated for each individual LAM for both series according to the following formula:TDI=((TA/TR×100%)−100%)×T−1TDI=((TA/TR×100%)−100%)×T−1where TDI is tissue deformation index (% per ms); TR, muscle thickness at rest (mm); TA, muscle thickness at maximal activation (mm); T, time to achieve maximal activation (ms).
Normality of distributions was checked using the Shapiro–Wilk test. Subsequently, differences in TDI between pain-free and painful conditions were compared using a parametric paired Student t test. Inter-muscle comparisons of the TDI were performed using one-way analysis of variance (ANOVA) with ‘muscle’ (TrA, IO, EO) set as a between subject factor, followed by the post hoc Tukey test. Alpha level was set at 0.05. For all calculations, Statistica software was applied (Statistica, Tulsa, USA).
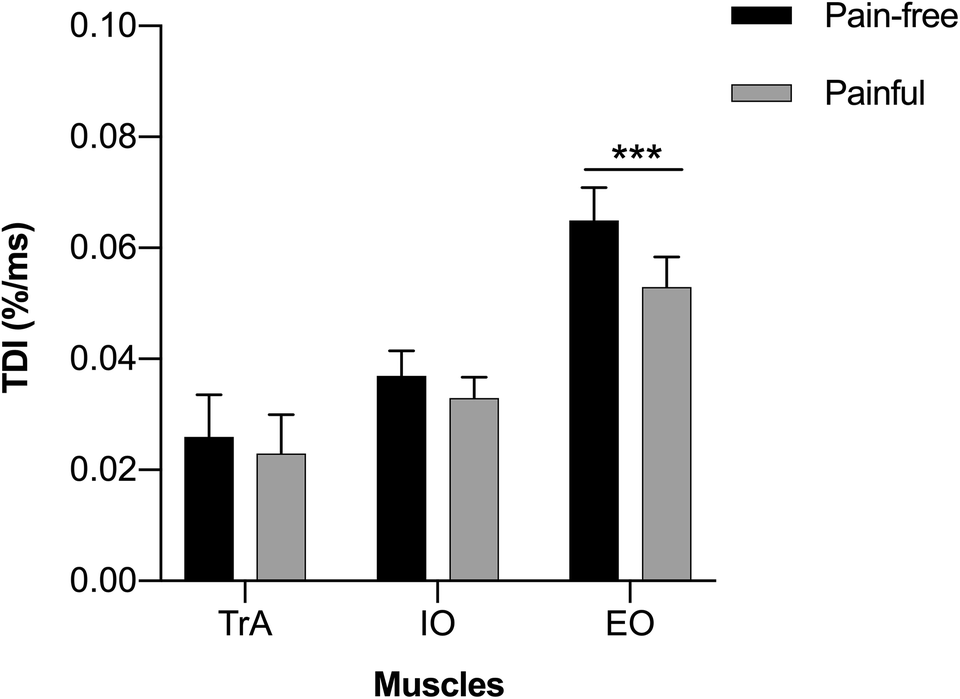
Since there were no significant differences of the TDI between right and left sides of the body (Student t test, p > 0.05), results concerning the two sides were pooled and analysed together. Generally, a decrease in the mean TDI was recorded between the pain-free and painful conditions (Fig. 2). For TrA, the TDI decreased from 0.026% ( ± 0.049, 95% CI 0.015–0.037) to 0.023% ( ± 0.045, 95% CI 0.013–0.033) per ms, respectively. For IO, TDI decreased from 0.037% ( ± 0 0.029, 95% CI 0.031–0.043) to 0.033% ( ± 0.024, 95% CI 0.028–0.038) per ms, and for EO it decreased from 0.065% ( ± 0.038, 95% CI 0.057–0.074) to 0.053% ( ± 0.035, 95% CI 0.046–0.061) per ms. Only in the case of the EO was the recorded decrease statistically significant (Student t test; t(83) = − 4.72; p = 0.00001).A characteristic inter-muscular gradient of the TDIs was observed, directed form inner towards outer muscular layers, with TrA presenting the lowest TDI (i.e. lowest velocity of thickness increase) and EO the highest (Fig. 3). In both pain-free and painful conditions, the ANOVA showed significant results (F(2, 249) = 30.09; p < 0.00001 and F(2, 249) = 20.74; p < 0.00001, respectively). For the pain-free condition, TDIs characterizing all addressed muscles were significantly different (Tukey test, TrA vs. IO p < 0.05; TrA vs. EO p < 0.0001; IO vs. EO p < 0.0001). The same was recorded for the painful condition (Tukey test, TrA vs. IO p < 0.05; TrA vs. EO p < 0.0001; IO vs. EO p < 0.001; Fig. 3).
Interestingly, a gradient occurred also in the variability of TDIs, with TrA showing the highest variability (the highest standard deviations, see above), and EO the lowest. For the pain-free condition, 26.19% of the subjects (n = 22) had negative TDI values for TrA, while for the painful condition 29.76% (n = 25). For IO, 5.95% (n = 5) and 1.19% (n = 1) were noted for pain-free and painful conditions, respectively. No negative TDIs were recorded in the case of EO. Additionally, LAMs spatial parameters in pain-free and painful conditions are presented in Table 2.Table 2
Mean values of the lateral abdominal muscles thickness in the control condition (pain-free) and during painful stimulation (painful)
| TrA (mm) | IO (mm) | EO (mm) | ||||
|---|---|---|---|---|---|---|
| TR | TA | TR | TA | TR | TA | |
| Pain-freea | 4.68 ( ± 1.39) | 5.16 ( ± 1.80) | 12.59 ( ± 3.70) | 14.17 ( ± 3.81) | 8.54 ( ± 2.18) | 10.68 ( ± 2.87) |
| Painfula | 4.70 ( ± 1.33) | 5.13 ( ± 1.73) | 12.96 ( ± 3.57) | 14.48 ( ± 3.88) | 8.80 ( ± 2.09) | 10.61 ( ± 2.62) |
TrA transversus abdominis, EO external oblique, IO internal oblique, TR thickness at rest, TA thickness at activation
aValues expressed as mean ± standard deviation
The most valuable outcomes of this study were that the obtained TDIs exhibited a characteristic gradient of muscles activation and that the implementation of experimental pain stimulus elicited TDI changes in LAMs. Low TDI values indicate a small change in thickness over time, while high values reflect faster tissue deformation. First, under pain-free conditions, we report a characteristic gradient of increasing TDI values from deep tissue layers (for TrA, 0.026% per ms) towards superficial layers (for IO, 0.037% and for EO, 0.065% per ms), which has also been reported in our previous work [14]. This finding can be explained by physiological adaptations. Superficial muscles are mainly built of fast-twitch muscle fibres [30, 31], which is reflected in high TDI values (e.g. EO). The deepest muscle (TrA) has a larger share of slow-twitch fibres and presents the lowest deformation index. This observation can also be explained from a functional point of view. Superficial muscles are often regarded as torque and motion producing, while deep muscles are considered stabilizing. Interestingly, this characteristic gradient was observed in pain-free as well as in painful condition, and all recorded TDIs were significantly different. We also noticed a specific gradient in the variability of TDI values in both pain-free and painful conditions independently, with TrA producing the highest score of negative TDI values from 26.19% (pain-free) to 29.76% (painful condition) and IO values from 5.95% (pain-free) to 1.19% (painful condition), with no negative EO TDIs. Transversus abdominis was the muscle that exhibited a decrease in thickness (possibly deactivation) most frequently. These findings are supported by the results of other experiments. Many authors noted that the mechanism of motor control of the deep abdominal muscles is based on random muscle activation in both normal and painful conditions [32-34]. This might suggest that ‘plasticity’ constitutes a characteristic feature of the pattern of deep abdominal muscle activation, and it often depends on the character of the given motor task (e.g. symmetrical or asymmetrical, internal or external forces) or on the environment (e.g. painful condition). Furthermore, none of the investigated muscles showed higher TDI with the pain stimulus. In experimental LBP conditions, we noticed a decrease in TDI mean values (TrA from 0.026 to 0.023% per ms, IO from 0.037 to 0.033% per ms and EO from 0.065 to 0.053% per ms). Only in the case of the EO was the recorded decrease statistically significant (Student t test p = 0.00001). These observations might indicate that an implementation of nociceptive input in the lower back region does not interrupt the physiological component of abdominal muscle activation, but influences their motor control, which is pronounced by their deactivation and is consistent with the data available in literature. Several studies have demonstrated that abdominal muscle function is disorganized in special conditions such as LBP [8, 35]. Hodges and Richardson [35] identified delayed activity of TrA with movements of the arm and leg during lower back experimental pain stimulation. Similar results were reported by Ferreira et al. [36], who used change in US measurements of thickness in abdominal muscles to find that people with LBP history use a different motor strategy of trunk control (especially TrA) during isometric lower leg tasks, compared to people without LBP. Our results indicate that there is a trend to decrease TDI values between the pain-free and pain conditions across LAMs, with significant differences in the EO muscle. In contrast to our results, several studies reported that in LBP patients, superficial muscles react with greater activity and decreased fatigability [37], or underline individual variation in EO activity [38]. Meanwhile, in our study we noticed a greater decrease in EO activity, compared to other abdominal muscles, which leads to the thesis that implementation of pain stimulus in lower back area affects motor control of superficial rather than deep muscles during postural perturbations. This finding may be useful in clinical practice and may partially explain the positive influence of general abdominal muscle strengthening exercises on pain and function in LBP patients [39, 40]. Limitations of our study include the participants. While the group was made up of healthy young subjects, they seemed to serve as a good reference for the symptomatic population. While we did not control the ultrasound array pressure during rapid arm movement, our raters were carefully trained and the recording procedure was fully standardized. Despite these factors, we were able to demonstrate the good reliability of the TDI [14]. The limitation might be the pain model itself. Transcutaneous electrical stimuli were used to induce rather superficial pain sensation. Thus, the source of nociception is limited and cannot be directly compared with true LBP arising from other structural causes, e.g. nerve root compression. It is recommended to replicate our results in clinical populations and healthy subjects exposed to different pain models.
TDI values for lateral abdominal muscles formed a gradient that increased from deep to superficial muscles. This gradient was observed in pain-free and painful conditions. Experimentally induced pain in the lower back influences motor control of the LAMs, which is reflected in the decrease of TDI values in the case of EO. TrA presented the largest percentage of negative TDI values in both conditions, and this is why it can be presumed as the most variable motor ‘unit’ in that muscle group. Further research is needed to investigate muscle deformations in patients with LBP.
WMA is supported by the scholarship ETIUDA5 funded by the National Science Centre in Poland (Grant No. 2017/24/T/HS6/00329).
The authors declare that they have no conflict of interest.
Springer Nature remains neutral with regard to jurisdictional claims in published maps and institutional affiliations.
586_2019_6016_MOESM1_ESM.pptx (607 kb)Supplementary file1 (PPTX 607 kb)
© The Author(s) 2019
Open AccessThis article is distributed under the terms of the Creative Commons Attribution 4.0 International License (http://creativecommons.org/licenses/by/4.0/), which permits unrestricted use, distribution, and reproduction in any medium, provided you give appropriate credit to the original author(s) and the source, provide a link to the Creative Commons license, and indicate if changes were made.
CrossMarkCite this article as:Biały, M., Adamczyk, W.M., Marczykowski, P. et al. Eur Spine J (2019) 28: 2444. https://doi.org/10.1007/s00586-019-06016-y