MRI histogram analysis enables objective and continuous classification of intervertebral disc degeneration
Waldenberg, C., Hebelka, H., Brisby, H. et al. Eur Spine J (2018) 27: 1042. https://doi.org/10.1007/s00586-017-5264-7
Abstract
Purpose
Magnetic resonance imaging (MRI) is the best diagnostic imaging method for low back pain. However, the technique is currently not utilized in its full capacity, often failing to depict painful intervertebral discs (IVDs), potentially due to the rough degeneration classification system used clinically today. MR image histograms, which reflect the IVD heterogeneity, may offer sensitive imaging biomarkers for IVD degeneration classification. This study investigates the feasibility of using histogram analysis as means of objective and continuous grading of IVD degeneration.
Methods
Forty-nine IVDs in ten low back pain patients (six males, 25–69 years) were examined with MRI (T2-weighted images and T2-maps). Each IVD was semi-automatically segmented on three mid-sagittal slices. Histogram features of the IVD were extracted from the defined regions of interest and correlated to Pfirrmann grade.
Results
Both T2-weighted images and T2-maps displayed similar histogram features. Histograms of well-hydrated IVDs displayed two separate peaks, representing annulus fibrosus and nucleus pulposus. Degenerated IVDs displayed decreased peak separation, where the separation was shown to correlate strongly with Pfirrmann grade (P < 0.05). In addition, some degenerated IVDs within the same Pfirrmann grade displayed diametrically different histogram appearances.
Conclusions
Histogram features correlated well with IVD degeneration, suggesting that IVD histogram analysis is a suitable tool for objective and continuous IVD degeneration classification. As histogram analysis revealed IVD heterogeneity, it may be a clinical tool for characterization of regional IVD degeneration effects. To elucidate the usefulness of histogram analysis in patient management, IVD histogram features between asymptomatic and symptomatic individuals needs to be compared.
Keywords
Histogram analysis IVD classification MRI Heterogeneity Diagnosis
Introduction
The most frequent source of chronic disability for both genders in working years is low back pain (LBP) [1, 2] resulting in major consequences for both the individual as well as for the society. The associated direct and indirect annual total costs for back pain are estimated to 1–2% of GDP [3, 4]. Degeneration of intervertebral discs (IVDs) is strongly associated with LBP and suggested to be the most common cause of LBP [5, 6, 7].
Magnetic resonance imaging (MRI) is sensitive to changes in cartilage structure and considered to be the best imaging method to evaluate IVD degeneration [8]. However, as conventional IVD degeneration measurements are qualitative and based on visual interpretation of MR images [9], the technique is currently not utilized in its full capacity. Qualitative grading of IVD degeneration is confined by subjective interpretation and limit degeneration classification to non-continuous grades. MRI sequences, enabling direct quantification of T1ρ and T2 relaxation time, have been developed and have showed promise for tissue characterization of the IVD [10, 11, 12].
As MR images display regional variations in signal intensity, i.e., pixel values, across the IVD tissue, the technique allows for quantification of the IVD heterogeneity. The signal variation in the MR images examined with histogram analysis may produce histogram features reflecting (1) the regional composition of the IVD tissue and (2) the grade of IVD degeneration [13], none of which is always visually apparent in MR images. If such histogram features would vary between LBP patients and individuals without pain, IVD histogram analysis may also be an important tool to identify painful IVDs.
The aim of this study was to examine the feasibility of histogram analysis to decode IVD heterogeneity with purpose not only to obtain a tool for objective and continuous grading of IVD degeneration but also to generate an indirect detailed map of how the regional IVD structures are affected by degeneration.
Materials and methods
Patients/intervertebral discs
Histogram features and its values for IVDs of Pfirrmann grade 1–4
Magnetic resonance imaging protocol
For morphological IVD imaging, high quality standardized sagittal T1-weighted (T1W) MRI was performed [320 × 320 matrix, slice thickness 3.5 mm, field of view (FOV) 300 × 300 mm2, number of excitations (NEX): 2]. Two MRI sequences, both sensitive to the water and proteoglycan content in the IVD tissue and the orientation and concentration of collagen fibers [14, 15], were also used reflecting the functional information of the IVD tissue. Namely, T2W-imaging which generate qualitative data (384 × 384 matrix, slice thickness 3.5 mm, FOV 300 × 300 mm2, NEX: 1) and T2-mapping generating quantitative data (256 × 256 matrix, slice thickness 3.5 mm, FOV 220 × 220 mm2, NEX: 1).
Post processing
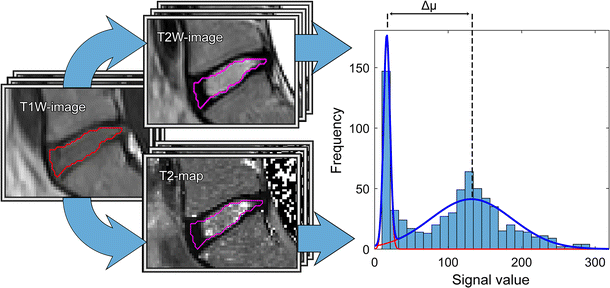
Schematic illustration of the workflow for retrieving histogram features. ROIs were placed on three mid-sagittal T1W-images which subsequently were transferred and rescaled to match T2W-images and T2-maps. The separation between high and low grey scale values, Δµ, was retrieved from analysis of histograms reflecting image data
Statistical analysis
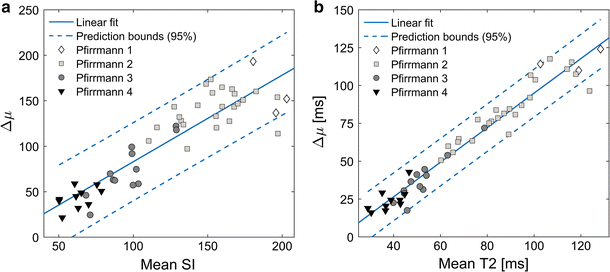
Mann–Whitney U test was performed to examine statistical significance between histogram features and Pfirrmann grade. Additionally, the correlation between Δµ and mean T2, as well as Δµ and the mean SI, was tested for significance. Statistical significance was defined as P < 0.05. All values are given as mean ± one standard deviation, if not otherwise stated.
Results
Histogram distribution
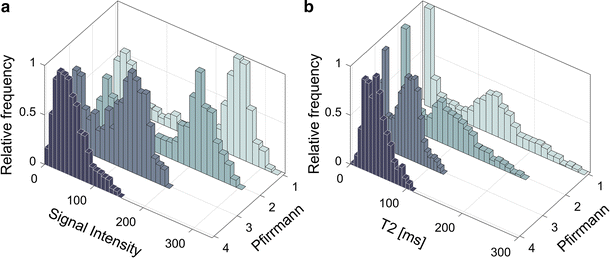
Typical histograms for a T2W-images and b T2-maps of discs with different grade of degeneration measured in terms of Pfirrmann grading
Correlation between histogram features and Pfirrmann grade
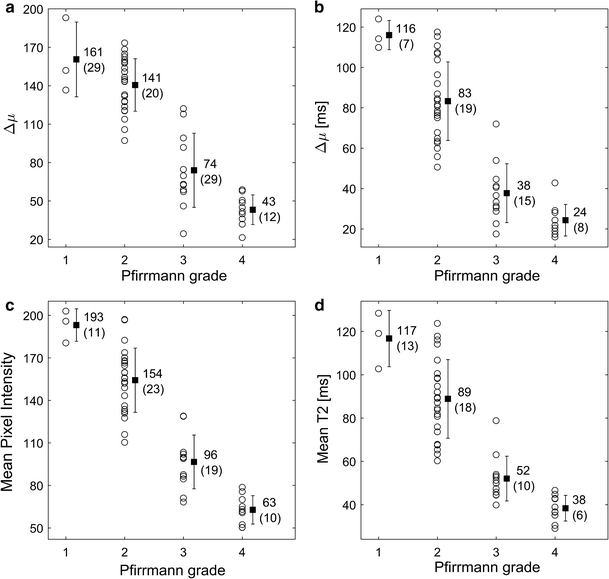
Pfirrmann grade versus a Δµ based on T2W-images, b Δµ based on T2-maps, c mean disc pixel intensity based on T2W-images and d mean disc T2 relaxation time based on T2-maps. The length of a whisker represents ± one standard deviation from the mean denoted in parenthesis. Each marker represents one intervertebral disc
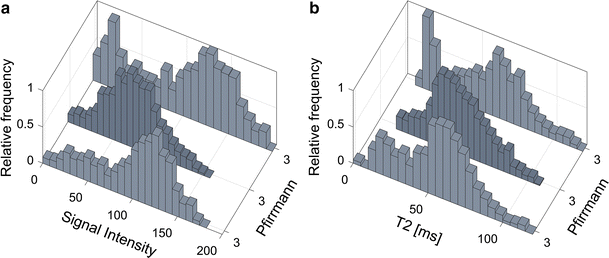
Example of vastly different histogram topology for discs all graded Pfirrmann 3. Histograms are based on IVD pixel values in a T2W-images and b T2-maps
Correlation between different histogram features
Gaussian peak separation, Δµ, plotted as a function of a mean IVD signal intensity, and bmean IVD T2 relaxation time
Discussion
In the pursuit of finding a tool for objective and continuous classification of IVD degeneration, this study investigated IVD grey scale distributions, i.e., histograms. It was shown that the decoding of the IVD heterogeneity with histogram analysis is feasible not only for T2-mapping, but also for conventional T2W-imaging. This is advantageous as conventional T2W MR images, compared to T2-maps, are frequently used in a clinical setting. Moreover, they offer reduced acquisition time while still maintaining the ability to convert qualitative data into quantitative data. It should be noted that T2W-imaging is sensitive to the choice of parameters for signal amplification. Consequently, only when all T2W-images are acquired using the same amplification settings in the MRI, as done in this study, the pixel values across all T2W-images can be compared.
Despite the fact that patients suffering from LBP to some extent have degenerative IVDs, conventional IVD degeneration measurements (Pfirrmann grading) alone cannot identify patients with lumbar pain. In contrast to Pfirrmann grading, which is a coarse and to some extent subjective marker of degeneration as it is based on visual interpretation [9], histogram analysis have the potential to objectively depict differences in the IVDs, not only between different grades, but also within single grades. Histogram analysis may thus produce sensitive IVD histogram features, which can be used for detection of early IVD degeneration, as well as a potential tool to evaluate early therapy response. In addition, IVD degeneration has been shown to correlate to Oswestry Disability Index [18], possibly enabling histogram features to indicate patient disability.
All investigated histogram features presented in this study correlated well with Pfirrmann grade. Compared to other studies, similar T2-values of the IVDs were retrieved [14, 16, 19]. Histogram analysis of IVDs of different Pfirrmann grades generated a wide and continuous range of Δµwhich shows that histogram analysis might be a suitable tool to be used for objective and continuous IVD degeneration classification. Histograms of non-degenerated IVDs based on T2W-images or T2-maps data should display two well separated peaks, one from AF and one from NP. In the process of IVD degeneration, an increased number of AF fissures are developed that may result in leakage of NP into the AF [20, 21]. Hypothetically, such leakage could be characterized by a region of high signal intensity in the otherwise low signal AF. One example of such high signal intensity in the IVD are High Intensity Zones (HIZ) which represents annular fissures [22]. Hypothetically, due to the common sub-voxel size of annulus fissures, only a minority of these fissures are fully visualized in MR images. Therefore, a detailed analysis and clear visualization of HIZ may be hampered by limited spatial resolution often restricted by the MRI slice thickness width. This might be a reason to the inconclusive research where some studies show HIZ being closely related to pain [23, 24], and other studies do not [25, 26]. Nonetheless, the “invisible” fissures and loss of water and collagen concentration in the NP may be identified by histogram analysis as an increase of intermediate histogram values and a decrease in Gaussian peak separation, Δµ, reflecting the tissue mixture in the voxel volume.
Histogram analysis revealed that histograms of some IVD grey scale distributions within the same Pfirrmann group exhibit vastly different histogram topology. One hypothesis to this phenomenon is that some IVDs may have a wide dorsal annular rift, visible as a clear HIZ, while other IVDs may have multiple smaller fissures generating more intermediate voxel values. Hence, histogram analysis may possibly generate objective features that are able to indicate differences in IVDs that macroscopically seem comparable, but at disc level differs between symptomatic and asymptomatic IVDs. Although fissures and HIZ have been associated with an ingrowth of nerve endings and granulation tissue, which is a prerequisite to cause pain [15], it is today not established how the distribution of fissures are related to LBP. With the use of quantitative IVD histogram features, extended investigations of the development of fissures within both clinical settings as well as in research can be performed.
This study would have benefitted from including more individuals with IVDs of Pfirrmann grade 1 and 5, to statistically determine correlation between histogram features and IVD degeneration in terms of Pfirrmann grade. However, as IVDs of Pfirrmann grade 1 are non-degenerated and IVDs of Pfirrmann grade 5 are extensively degenerated and almost fused, these groups are of less interest regarding interventional measures. Another limitation of this study is that the IVD evaluation covered only a mid-sagittal IVD width of about one centimetre. An evaluation covering a larger IVD volume, without increasing the image slice thickness, could potentially more accurately describe the regional heterogeneity also in lateral regions. It is known that the spine is a dynamic structure which is influenced by axial load or recumbency [27, 28]. As all imaging was done with the patients in a supine position without axial load, the IVD morphological state might have deviated from upright standing conditions. Future studies are warranted to examine the loading effect.
Quantification of unique regional patterns in MR images, such as histogram patterns, is emerging for phenotyping of different tissues. By integrating histogram analysis with automatic techniques for image analysis, e.g. machine learning [29], image data can be effectively extracted in a more clinically feasible way.
Development of a fully automatic segmentation algorithm should be considered as it could reduce variations in the location and size of the ROI and ultimately reduce the spread of calculated data. As only patients with chronic LBP were studied, it is currently unknown if IVD histogram analysis between an asymptomatic and symptomatic group would differ. Studies in which IVD histogram features of asymptomatic and symptomatic individuals are compared are warranted. Such studies might indicate whether histogram features can improve patient management and indicate LBP.
Conclusion
This study shows that decoding of the IVD heterogeneity with histogram analysis is feasible not only for T2-mapping, but also for conventional T2W-imaging. Histogram features correlated well with IVD degeneration, determined with Pfirrmann grading, suggesting that IVD histogram analysis is a suitable tool for objective and continuous IVD degeneration classification. Moreover, as histogram analysis reveals the IVD heterogeneity, it may be a clinical tool for characterization of regional degeneration effects on IVD structures.
Notes
Acknowledgements
The authors acknowledge the financial support from C4I center, Sahlgrenska University Hospital and the Innovation Fund, The region of West Sweden.
Compliance with ethical standards
Conflict of interest
Authors declare that they have no conflict of interest.
Ethical approval
All procedures performed in studies involving human participants were in accordance with the ethical standards of the institutional and/or national research committee and with the 1964 Helsinki declaration and its later amendments or comparable ethical standards.
Informed consent
Oral and written informed consent was obtained from all individual participants included in the study.
References
-
1.Andersson GB (1999) Epidemiological features of chronic low-back pain. Lancet (London, England) 354(9178):581–585. doi: 10.1016/s0140-6736(99)01312-4CrossRefGoogle Scholar
-
2.Modic MT, Ross JS (2007) Lumbar degenerative disk disease. Radiology 245(1):43–61. doi: 10.1148/radiol.2451051706CrossRefPubMedGoogle Scholar
-
3.Hansson EK, Hansson TH (2005) The costs for persons sick-listed more than one month because of low back or neck problems. A two-year prospective study of Swedish patients. Eur Spine J Off Publ Eur Spine Soc Eur Spinal Deform Soc Eur Sect Cerv Spine Res Soc 14(4):337–345. doi: 10.1007/s00586-004-0731-3CrossRefGoogle Scholar
-
4.Hoy D, March L, Brooks P, Blyth F, Woolf A, Bain C, Williams G, Smith E, Vos T, Barendregt J, Murray C, Burstein R, Buchbinder R (2014) The global burden of low back pain: estimates from the Global Burden of Disease 2010 study. Ann Rheum Dis 73(6):968–974. doi: 10.1136/annrheumdis-2013-204428CrossRefPubMedGoogle Scholar
-
5.Luoma K, Riihimäki H, Luukkonen R, Raininko R, Viikari-Juntura E, Lamminen A (2000) Low back pain in relation to lumbar disc degeneration. Spine 25(4):487–492CrossRefPubMedGoogle Scholar
-
6.Salminen JJ, Erkintalo MO, Pentti J, Oksanen A, Kormano MJ (1999) Recurrent low back pain and early disc degeneration in the young. Spine 24(13):1316–1321CrossRefPubMedGoogle Scholar
-
7.Hancock M, Maher C, Macaskill P, Latimer J, Kos W, Pik J (2012) MRI findings are more common in selected patients with acute low back pain than controls? Eur Spine J Off Publ Eur Spine Soc Eur Spinal Deform Soc Eur Sect Cerv Spine Res Soc 21(2):240–246. doi: 10.1007/s00586-011-1955-7CrossRefGoogle Scholar
-
8.Jarvik JG, Deyo RA (2002) Diagnostic evaluation of low back pain with emphasis on imaging. Ann Intern Med 137(7):586–597CrossRefPubMedGoogle Scholar
-
9.Pfirrmann CW, Metzdorf A, Zanetti M, Hodler J, Boos N (2001) Magnetic resonance classification of lumbar intervertebral disc degeneration. Spine 26(17):1873–1878CrossRefPubMedGoogle Scholar
-
10.Jenkins JPR, Hickey DS, Zhu XP, Machin M, Isherwood I (1985) MR imaging of the intervertebral disc: a quantitative study. Br J Radiol 58(692):705–709. doi: 10.1259/0007-1285-58-692-705CrossRefPubMedGoogle Scholar
-
11.Auerbach JD, Johannessen W, Borthakur A, Wheaton AJ, Dolinskas CA, Balderston RA, Reddy R, Elliott DM (2006) In vivo quantification of human lumbar disc degeneration using T1ρ-weighted magnetic resonance imaging. Eur Spine J 15(3):338–344. doi: 10.1007/s00586-006-0083-2CrossRefPubMedCentralGoogle Scholar
-
12.Stelzeneder D, Welsch GH, Kovács BK, Goed S, Paternostro-Sluga T, Vlychou M, Friedrich K, Mamisch TC, Trattnig S (2012) Quantitative T2 evaluation at 3.0 T compared to morphological grading of the lumbar intervertebral disc: a standardized evaluation approach in patients with low back pain. Eur J Radiol 81(2):324–330. doi: 10.1016/j.ejrad.2010.12.093CrossRefPubMedGoogle Scholar
-
13.Michopoulou S, Costaridou L, Vlychou M, Speller R, Todd-Pokropek A (2011) Texture-based quantification of lumbar intervertebral disc degeneration from conventional T2-weighted MRI. Acta Radiol (Stockholm, Sweden: 1987) 52(1):91–98. doi: 10.1258/ar.2010.100166Google Scholar
-
14.Watanabe A, Benneker LM, Boesch C, Watanabe T, Obata T, Anderson SE (2007) Classification of intervertebral disk degeneration with axial T2 mapping. AJR Am J Roentgenol 189(4):936–942. doi: 10.2214/ajr.07.2142CrossRefPubMedGoogle Scholar
-
15.Brayda-Bruno M, Tibiletti M, Ito K, Fairbank J, Galbusera F, Zerbi A, Roberts S, Wachtel E, Merkher Y, Sivan SS (2014) Advances in the diagnosis of degenerated lumbar discs and their possible clinical application. Eur Spine J 23(Suppl 3):S315–S323. doi: 10.1007/s00586-013-2960-9CrossRefPubMedGoogle Scholar
-
16.Marinelli NL, Haughton VM, Anderson PA (2010) T2 relaxation times correlated with stage of lumbar intervertebral disk degeneration and patient age. AJNR Am J Neuroradiol 31(7):1278–1282. doi: 10.3174/ajnr.A2080CrossRefPubMedGoogle Scholar
-
17.Welsch GH, Trattnig S, Paternostro-Sluga T, Bohndorf K, Goed S, Stelzeneder D, Mamisch TC (2011) Parametric T2 and T2* mapping techniques to visualize intervertebral disc degeneration in patients with low back pain: initial results on the clinical use of 3.0 Tesla MRI. Skelet Radiol 40(5):543–551. doi: 10.1007/s00256-010-1036-8CrossRefGoogle Scholar
-
18.Middendorp M, Vogl TJ, Kollias K, Kafchitsas K, Khan MF, Maataoui A (2016) Association between intervertebral disc degeneration and the Oswestry Disability Index. J Back Musculoskelet Rehabil. doi: 10.3233/bmr-150516Google Scholar
-
19.Kerttula L, Kurunlahti M, Jauhiainen J, Koivula A, Oikarinen J, Tervonen O (2001) Apparent diffusion coefficients and T2 relaxation time measurements to evaluate disc degeneration: a quantitative MR study of young patients with previous vertebral fracture. Acta Radiol 42(6):585–591. doi: 10.1080/028418501127347241PubMedGoogle Scholar
-
20.McCarron RF, Wimpee MW, Hudkins PG, Laros GS (1987) The inflammatory effect of nucleus pulposus: a possible element in the pathogenesis of low-back pain. Spine 12(8):760–764CrossRefPubMedGoogle Scholar
-
21.Sugiura K, Tonogai I, Matsuura T, Higashino K, Sakai T, Suzue N, Hamada D, Goto T, Takata Y, Nishisho T, Goda Y, Sato R, Kondo K, Tezuka F, Mineta K, Takeuchi M, Takahashi M, Egawa H, Sairyo K (2014) Discoscopic findings of high signal intensity zones on magnetic resonance imaging of lumbar intervertebral discs. Case Rep Orthop 2014:5. doi: 10.1155/2014/245952Google Scholar
-
22.Aprill C, Bogduk N (1992) High-intensity zone: a diagnostic sign of painful lumbar disc on magnetic resonance imaging. Br J Radiol 65(773):361–369. doi: 10.1259/0007-1285-65-773-361CrossRefPubMedGoogle Scholar
-
23.Peng B, Hou S, Wu W, Zhang C, Yang Y (2006) The pathogenesis and clinical significance of a high-intensity zone (HIZ) of lumbar intervertebral disc on MR imaging in the patient with discogenic low back pain. Eur Spine J 15(5):583–587. doi: 10.1007/s00586-005-0892-8CrossRefPubMedGoogle Scholar
-
24.Schellhas KP, Pollei SR, Gundry CR, Heithoff KB (1996) Lumbar disc high-intensity zone: correlation of magnetic resonance imaging and discography. Spine 21(1):79–86CrossRefPubMedGoogle Scholar
-
25.Pande KC, Khurjekar K, Kanikdaley V (2009) Correlation of low back pain to a high-intensity zone of the lumbar disc in Indian patients. J Orthop Surg (Hong Kong) 17(2):190–193CrossRefGoogle Scholar
-
26.Hebelka H, Hansson T (2013) HIZ’s relation to axial load and low back pain: investigated with axial loaded MRI and pressure controlled discography. Eur Spine J 22(4):734–739. doi: 10.1007/s00586-012-2501-yCrossRefPubMedGoogle Scholar
-
27.Nilsson M, Lagerstrand K, Kasperska I, Brisby H, Hebelka H (2016) Axial loading during MRI influences T2-mapping values of lumbar discs: a feasibility study on patients with low back pain. Eur Spine J 25(9):2856–2863. doi: 10.1007/s00586-016-4670-6CrossRefPubMedGoogle Scholar
-
28.Belavy DL, Quittner M, Ling Y, Connell D, Rantalainen T (2017) Cervical and thoracic intervertebral disc hydration increases with recumbency: a study in 101 healthy volunteers. Spine J. doi: 10.1016/j.spinee.2017.06.006PubMedGoogle Scholar
-
29.Jamaludin A, Lootus M, Kadir T, Zisserman A, Urban J, Battie MC, Fairbank J, McCall I (2017) ISSLS PRIZE IN BIOENGINEERING SCIENCE 2017: automation of reading of radiological features from magnetic resonance images (MRIs) of the lumbar spine without human intervention is comparable with an expert radiologist. Eur Spine J 26(5):1374–1383. doi: 10.1007/s00586-017-4956-3