Clinical course and prognostic models for the conservative management of cervical radiculopathy: a prospective cohort study.
Sleijser-Koehorst, M.L.S., Coppieters, M.W., Heymans, M.W. et al. Eur Spine J (2018) 27: 2710.
https://doi.org/10.1007/s00586-018-5777-8
Abstract
Purpose
To describe the clinical course and develop prognostic models for poor recovery in patients with cervical radiculopathy who are managed conservatively.
Methods
Sixty-one consecutive adults with cervical radiculopathy who were referred for conservative management were included in a prospective cohort study, with 6- and 12-month follow-up assessments. Exclusion criteria were the presence of known serious pathology or spinal surgery in the past. Outcome measures were perceived recovery, neck pain intensity and disability level. Multiple imputation analyses were performed for missing values. Prognostic models were developed using multivariable logistic regression analyses, with bootstrapping techniques for internal validation.
Results
About 55% of participants reported to be recovered at 6 and 12 months. All multivariable models contained 2 baseline predictors. Longer symptoms duration increased the risk of poor perceived recovery, whereas the presence of paresthesia decreased this risk. A higher neck pain intensity and a longer duration of symptoms increased the risk of poor relief of neck pain. A higher disability score increased the risk of poor relief of disability, and larger active range of rotation toward the affected side decreased this risk. Following bootstrapping, the explained variance of the models varied between 0.22 and 0.30, and the median area under the curve varied between 0.75 and 0.79.
Conclusions
The clinical course of cervical radiculopathy appears to be long, with most of the reduction in symptoms occurring within the first 6 months. All prognostic models showed an adequate predictive performance with modest diagnostic accuracy and explained variance.
Keywords
Neuropathic pain Neck pain Recovery Prognosis Prognostic factors Prediction
Introduction
Cervical radiculopathy occurs when a cervical nerve root is compressed or inflamed [1, 2]. Patients with cervical radiculopathy typically report arm pain, neck pain and sensory deficits along the distribution area of the affected nerve root(s) [1, 3]. Although there are no universally accepted diagnostic criteria for cervical radiculopathy [4], the diagnosis is usually based on a combination of clinical signs and symptoms, combined with magnetic resonance imaging (MRI). Most patients are initially treated conservatively, but when conservative treatment fails or in severe conditions, surgery is considered [5, 6].
Knowledge of the course and prognostic factors is imperative to provide accurate information to patients with cervical radiculopathy about the prognosis. Several, mostly older studies, describe the course of cervical radiculopathy [2, 3, 7]. Generally, cervical radiculopathy appears to have a favorable but lengthy course, with 70–90% of patients reporting no or mild symptoms after 5–10 years [2, 3, 7]. A recent systematic review revealed that 83% of patients with cervical radiculopathy due to cervical disk herniation recovered within 24–36 months. Most of the improvement occurred within 4–6 months after onset [7]. As conservative management is usually the initial treatment for patients with cervical radiculopathy, it is important to have a better understanding of the clinical course of the disorder and prognostic factors which may influence this course [5, 6].
There is a paucity of information on prognostic factors for cervical radiculopathy [7]. A recent systematic review reported that patients with a workers’ compensation claim appeared to have a poorer prognosis [7]. One study identified several factors to be predictive for successful short-term recovery following physiotherapy [8]. However, to date, no study has described a prognostic model for long-term outcome in conservatively managed patients with cervical radiculopathy. Therefore, this study aimed to describe the clinical course, and develop and internally validate prognostic models for poor prognosis in conservatively managed patients with cervical radiculopathy.
Methods
Design
This is a prospective cohort study with a 6- and 12-month follow-up. The Medical Ethics Committee of the Elisabeth Hospital in Tilburg, The Netherlands, approved the study. All participants provided written informed consent prior to participating.
Participants
Participants were recruited between July 2013 and October 2014. Consecutive patients with cervical radiculopathy who were referred to a multidisciplinary clinic in The Netherlands by their general practitioner or medical specialist were eligible for participation. All participants underwent MRI scanning before entering the study. A neurosurgeon with extensive (i.e., > 10 years) clinical experience in managing patients with cervical radiculopathy reached the diagnosis of cervical radiculopathy if clinical findings from the history and physical examination (e.g., pain, numbness, paresthesia, muscle strength, and reflex changes) corresponded with nerve root compression observed on MRI. Inclusion criteria for this study were: diagnosis of cervical radiculopathy due to disk herniation, stenosis or a combination, at least 18 years of age, referred for conservative management and adequate understanding of the Dutch language to complete the questionnaires. Patients were excluded in case of known serious pathology (such as malignancies, fractures, (rheumatoid) arthritis, infections or myelopathy), multiple sclerosis, diabetes mellitus, polyneuropathy, complex regional pain syndrome or a history of spinal surgery.
Procedure
At baseline, patients provided information regarding demographics and potential prognostic factors via electronic questionnaires. The neurosurgeon performed a clinical neurological examination. After 6 and 12 months, patients completed a digital survey of questions regarding the current level of recovery (Global Perceived Effect scale [9]); questions regarding their level of symptoms (including Numeric Pain Rating Scales for neck pain, arm pain and disability [10]); sick leave due to the cervical radiculopathy (duration in weeks); treatment received (i.e., physical therapy, manual therapy, injections, medication, other) and medication use (type and amount). A copy of the digital survey is provided in Appendix 1. Participants who did not respond to the electronic questionnaire, received a reminder after 1 and 2 weeks, followed by a final reminder via a telephone call.
Outcomes
The course of cervical radiculopathy was described in terms of perceived recovery, neck and arm pain intensity and perceived disability at 6 and 12 months. Additionally, we determined the proportion of participants with a high pain intensity at 6 and 12 months, i.e., a score of 7 or higher on an 11-point Numeric Rating Scale (NRS) [10, 11].
The primary outcome measure for the prognosis was the perceived recovery at 12 months, measured on a 7-point Global Perceived Effect (GPE) scale [9]. Patients were considered recovered if they scored ‘completely recovered’ or ‘much improved’ [9]. Secondary outcome measures were neck pain intensity and disability level at 12 months. Patients were considered recovered if they scored ≤ 2 for neck pain intensity and disability on an 11-point NRS, ranging from 0 to 10 [12].
Potential predictors
Overview of predictors included in the multivariable logistic regression analyses per outcome
Poor recovery |
1. Presence of neck pain (yes/no) |
2. Presence of low back pain (yes/no) |
3. Presence of paresthesia in the arm or hand (yes/no) |
4. Arm pain worse than neck pain (yes/no) |
5. Duration of symptoms (weeks) |
6. Active rotation to the affected side (degrees) |
Neck pain |
1. Presence of neck pain (yes/no) |
2. Neck pain intensity (0–10 NRS) |
3. Presence of low back pain (yes/no) |
4. Duration of symptoms (weeks) |
5. Arm pain worse than neck pain (yes/no) |
6. Prior episode of neck pain (yes/no) |
Disability |
1. Active rotation to the affected side (degrees) |
2. Level of disability (0–10 NRS) |
3. Presence of low back pain (yes/no) |
4. PainDETECT Screening Questionnaire (0–38) |
5. Prior episode of neck pain (yes/no) |
6. Deep neck flexor endurance (s) |
Statistical analysis
Missing values
We performed several missing value analyses: First, we performed Little’s MCAR test, to determine whether values were missing (completely) at random. Then we compared the main baseline characteristics of participants with and without missing data, to determine if there were any relevant differences between the groups. We compared the characteristics both visually and statistically with independent sample t tests and Mann–Whitney U tests.
Clinical course
The clinical course of cervical radiculopathy at 6 and 12 months was described using descriptive statistics. We used complete-case analyses to determine the clinical course of cervical radiculopathy.
Prognostic models
Multiple imputation methods were performed on the predictor and outcome measures with missing values. We used the Multivariate Imputation by Chained Equations (MICE) method with linear method imputation, and the number of imputations was related to the amount of missing data [13, 14, 20]. Demographic variables, predictor variables and the 6- and 12-month outcome variables were included in the imputation models [20].
We performed multivariable logistic regression analyses for each primary and secondary outcome in the imputed dataset. A priori, we aimed to include six factors in our models. The common rule of thumb states that the sample size for multivariable regression should be approximately 10 events in the smallest group per factor included in the analyses [13]. Therefore, we aimed to include a minimum of 60 participants in the smallest group (i.e., either recovered or non-recovered at 12 months) [13]. However, the final dataset was smaller than anticipated, because of the strict criteria we used to diagnose cervical radiculopathy. The recruitment period could not be extended, but initiatives were taken to maximize enrollment of suitable patients within the predefined time frame. This restricted the number of possible predictors per outcome. Because it was difficult to determine the three most relevant predictors for each outcome based on theoretical plausibility, we decided to include all six predefined predictors and apply strict bootstrapping techniques to correct for overfitting.
We used a manual backward selection procedure in the pooled analysis model, in which the factor with the highest significance level was removed, until all variables in the model had a pvalue < 0.157 [13, 21]. The predictive influence of the predictor was estimated by the odds ratio (OR). Performance of the model was determined by the explained variance and the accuracy of the model. The explained variance is described in terms of the Nagelkerke R2. The accuracy of the prognostic models was determined by the area under the curve (AUC). An AUC < 0.6 means that the prognostic model has no discriminatory value, an AUC > 0.8 reflects good discriminatory value [22]. Since no universal method has been described, the pooled AUC and Nagelkerke R2 were acquired by determining the median of the individual AUCs and Nagelkerke R2 of the imputed datasets [14].
The internal validity of the models was assessed through bootstrapping techniques with 500 repetitions. Bootstrapping is the preferred method for internal validation to determine the optimism in the initially developed model, based on the model’s performance in numerous (i.e., 500) bootstrap samples derived from the complete dataset. It determines a shrinkage factor that can be used to adjust the regression coefficient and performance indicators to correct for any optimism and to better reflect the actual performance of the model [13]. The models were internally validated in terms of explained variance and accuracy. The statistical analyses were performed in IBM SPSS, version 23 (IBM Corp, Armonk, NY, USA) and the bootstrap techniques in R statistics. All methods are reported in accordance with the Transparent Reporting of a multivariable prediction model for Individual Prognosis or Diagnosis (TRIPOD) guideline [13, 14].
Results
Participants
Baseline characteristics and follow-up measures at 6 and 12 months
Baseline |
6 months |
12 months |
|
---|---|---|---|
Age in years |
49.5 (9.0) |
||
Female |
54% |
||
Duration of symptoms in weeks* |
26 (96) |
||
Education level |
|||
Low |
13% |
||
Middle |
71% |
||
High |
16% |
||
Work |
|||
Part-time |
31% |
||
Fulltime (≥ 36 h/week) |
54% |
||
Not applicable |
15% |
||
Cause of nerve root compression** |
|||
Disk herniation |
43% |
||
Stenosis |
14% |
||
Combination of both |
43% |
||
Location disk herniation** |
|||
Foraminal |
48% |
||
(Para)median |
17% |
||
Lateral |
5% |
||
Other (e.g., broad based) |
16% |
||
Not applicable (e.g., stenosis) |
14% |
||
Symptoms |
|||
Neck pain |
74% |
61% |
66% |
Arm pain |
98% |
42% |
55% |
Paresthesia arm and/or hand |
82% |
39% |
42% |
Numbness arm and/or hand |
64% |
42% |
32% |
Neck pain intensity* |
5 (6) |
3 (6) |
3 (5) |
Arm pain intensity* |
6 (2) |
1 (5) |
3 (4) |
Disability* |
5 (4) |
3 (5) |
2 (5) |
PainDETECT screening questionnaire |
12.6 (5.4) |
||
Sick leave during last 6 months |
36% |
27% |
13% |
Duration of sick leave in weeks* |
0 (3) |
0 (4) |
0 (0) |
Treatment received (excl. medication)‡ |
56% |
45% |
|
Physiotherapy |
29% |
32% |
|
Manual therapy§ |
34% |
32% |
|
Corticosteroid injection therapy |
42% |
40% |
|
Other (e.g., acupuncture, diet) |
24% |
14% |
|
Current medication use† |
59% |
34% |
26% |
Paracetamol |
31% |
44% |
29% |
NSAIDs |
33% |
24% |
18% |
Tramadol |
16% |
12% |
5% |
Morphine |
8% |
2% |
0% |
Antidepressants |
5% |
5% |
3% |
Anti-epileptics |
3% |
0% |
3% |
Other |
7% |
7% |
8% |
Global perceived effect |
|||
Completely recovered |
12% |
13% |
|
Much improved |
44% |
42% |
|
Slightly improved |
24% |
24% |
|
Not changed |
17% |
13% |
|
Slightly worsened |
2% |
5% |
|
Much worsened |
0% |
3% |
|
Worse than ever |
0% |
0% |
|
Recovered (dichotomized) |
|||
GPE recovered |
56% |
55% |
|
Neck pain recovered |
42% |
47% |
|
Arm pain recovered |
59% |
47% |
|
Disability recovered |
46% |
58% |
Missing value analyses
Baseline characteristics of patients with complete data compared to patients with missing data
12-months follow-up |
Complete data |
Missing data |
---|---|---|
Age in years |
51 (13) |
48 (12) |
Female |
63% |
39% |
Education level |
||
Low |
13% |
13% |
Middle |
71% |
70% |
High |
16% |
17% |
Prior neck pain |
68% |
65% |
Muscle weakness |
61% |
61% |
Paresthesia |
82% |
83% |
Duration of symptoms in weeks |
24 (95) |
26 (96) |
Sick leave duration* in weeks |
0 (1) |
0 (6) |
Neck pain intensity* |
5 (6) |
5 (7) |
Arm pain intensity* |
7 (3) |
6 (2) |
Disability level* |
5 (5) |
5 (3) |
Clinical course
At 6 months and at 12 months, ~ 55% of patients reported to be recovered on the GPE scale. At 6 months, 42% reported to be recovered in terms of neck pain and 47% at 12 months. The median neck pain intensity decreased from 5 to 3 at 6 months and remained 3 at 12 months. Fifty-nine percent of patients reported no or only slight arm pain at 6 months, which decreased to 47% at 12 months. The median arm pain intensity decreased from 7 to 1 at 6 months, and increased to 3 at 12 months. The proportion of patients who experienced high-intensity neck pain was 24% at 6 months and 18% at 12 months. For high-intensity arm pain, the proportions were 17% (6 months) and 11% (12 months). At 6 months, 46% reported to be recovered in terms of disability, which further improved to 58% at 12 months. The median level of disability reduced from 5 at baseline, to 3 at 6 months and 2 at 12 months. The proportion of patients experiencing high-level disability was 15% (6 months) and 13% (12 months).
With respect to management, 59% of patients used medication at baseline, which decreased to 34% at 6 months and 26% at 12 months. Approximately 30% of patients received physiotherapy, ~ 33% manual therapy and ~ 40% corticosteroid injections. Some participants underwent more than one intervention. Table 2 provides a detailed overview of the clinical course.
Multivariable logistic regression analyses
Final model for poor perceived recovery at 12 months (N = 61)
Predictor |
OR (95% CI)† |
Beta† |
Adjusted beta‡ |
---|---|---|---|
Paresthesia (yes)□ |
0.18 (0.03–1.10) |
− 1.72 |
− 1.21 |
Duration of symptoms (weeks) |
1.01* (1.00–1.02) |
0.012 |
0.008 |
Performance measures |
Median (IQR) R2 |
Median (IQR) AUC |
---|---|---|
Initial† |
0.37 (0.29–0.43) |
0.82 (0.80–0.85) |
Bootstrap§ |
0.22 (0.14–0.29) |
0.75 (0.70–0.77) |
Final model for poor recovery of neck pain at 12 months (N = 61)
Predictor |
OR (95% CI)† |
Beta† |
Adjusted beta‡ |
---|---|---|---|
Baseline neck pain intensity (0–10) |
1.42* (1.04–1.95) |
0.35* |
0.26 |
Duration of symptoms (weeks) |
1.01 (1.00–1.03) |
0.01 |
0.01 |
Performance measures |
Median R2 (IQR) |
Median AUC (IQR) |
---|---|---|
Initial† |
0.45 (0.40–0.49) |
0.84 (0.82–0.86) |
Bootstrap§ |
0.30 (0.25–0.36) |
0.79 (0.77–0.81) |
Final model for poor recovery of disability level at 12 months (N = 61)
Predictor |
OR (95% CI)† |
Beta† |
Adjusted beta‡ |
---|---|---|---|
ROM rotation affected side (degrees) |
0.94* (0.88–1.00) |
− 0.07* |
− 0.05 |
Baseline disability score (0–10) |
1.40 (1.00–1.95) |
0.33 |
0.22 |
Performance measures |
Median R2 (IQR) |
Median AUC (IQR) |
---|---|---|
Initial† |
0.41 (0.36–0.49) |
0.83 (0.80–0.87) |
Bootstrap§ |
0.25 (0.19–0.35) |
0.76 (0.73–0.82) |
Prognostic models
The prognostic model for perceived poor recovery contained two baseline predictors: ‘presence of paresthesia’ and ‘duration of symptoms’. People with a longer duration of symptoms had a higher risk for persistent symptoms, and people with paresthesia had a reduced risk (Table 4). The prognostic model for poor relief of neck pain consisted of two baseline factors: ‘neck pain intensity’ and ‘duration of symptoms,’ indicating a higher risk of persistent neck pain for patients with a higher baseline neck pain intensity and a longer duration of symptoms (Table 5). For disability, the prognostic model also contained two baseline factors: ‘active rotation toward the affected side’ and ‘baseline disability score.’ Patients with a greater active rotation toward the affected side had a lower risk for persistent disability, and patients with a higher baseline disability score had a higher risk (Table 6).
The median explained variance (R2) varied between 0.37 and 0.45 for the three prognostic models. The median AUC varied between 0.82 and 0.84. Following bootstrapping, the explained variance decreased and varied between 0.22 and 0.30, and the median AUC varied between 0.75 and 0.79 for the three models (Tables 4, 5 and 6).
Discussion
This study aimed to describe the clinical course of cervical radiculopathy for those patients who are managed conservatively and to derive prognostic models to identify patients at risk for poor recovery.
Clinical course
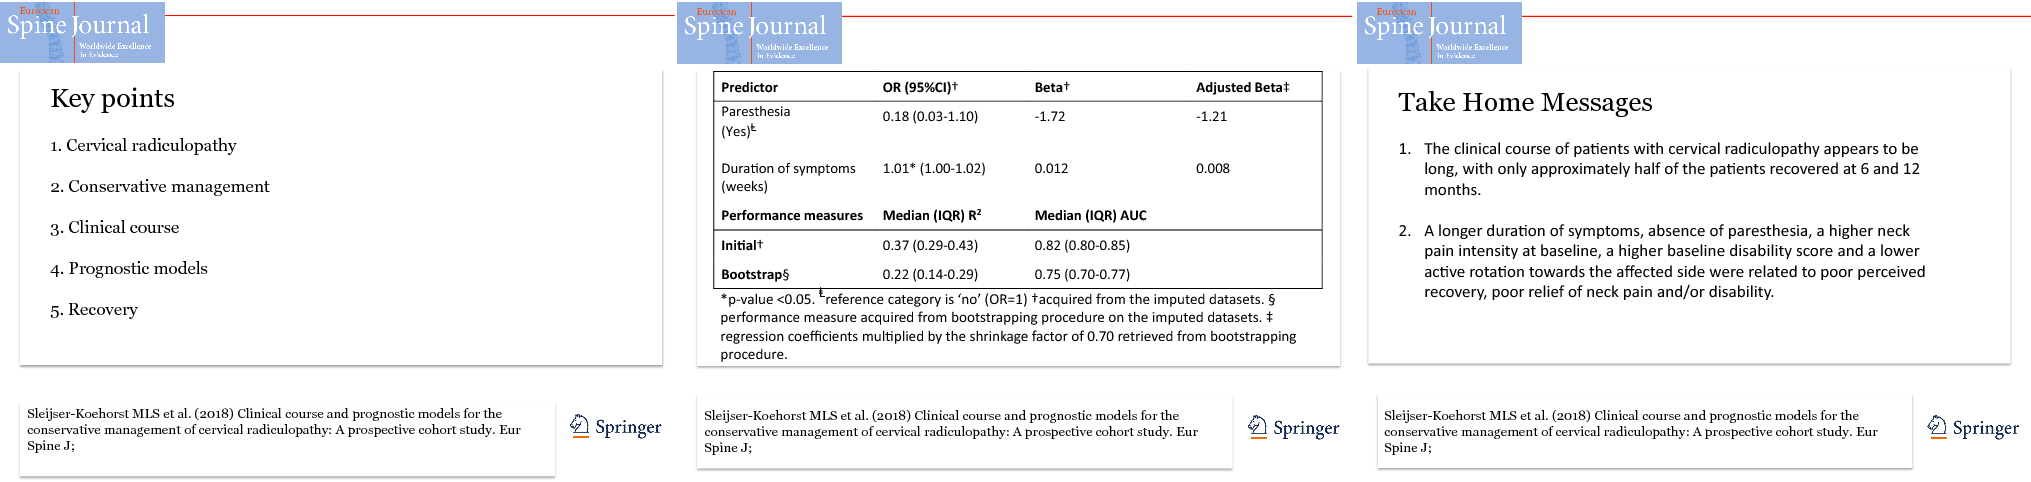
According to the findings regarding perceived effect, approximately half of the patients indicated to be recovered at 6 and 12 months. Similar proportions were observed for neck and arm pain recovery. Although the mean reported pain intensities (3/10 NRS) and level of disability (2/10 NRS) were fairly low at 12 months, the variability between patients was rather large. Approximately 20% of patients still experienced high-intensity pain and high level of disability at 6 months, and ~ 15% at 12 months. In addition, ~ 20% of patients took medication typically prescribed for moderate to severe (neuropathic) pain at 6 months, and ~ 10% at 12 months (opioids, antidepressants and anti-epileptics). It is noteworthy that recovery, pain and disability levels were similar at 6 and 12 months, indicating that further improvement between 6 and 12 months was limited.
A recent systematic review summarizing two studies revealed that most improvement occurs in the first 4–6 months and that 83% of patients recovered completely within 2–3 years [7]. In our study, the long-term recovery (12 months) was less favorable, possibly because we included a larger proportion of patients with a longer history of symptoms. This seems a plausible explanation, since longer duration of symptoms was associated with poor recovery in our multivariable prognostic models.
Prognosis
The multivariable logistic regression analyses generated plausible prognostic models containing a combination of predictors that are commonly captured and easily obtainable in clinical practice. A longer duration of symptoms, absence of paresthesia, a higher neck pain intensity at baseline, a higher baseline disability score and a lower active rotation toward the affected side were related to poor perceived recovery, poor relief of neck pain and/or disability at 12 months. After bootstrapping, all prognostic models showed an adequate predictive performance with modest diagnostic accuracy and explained variance. The results indicate that the models may potentially be useful to identify patients with a less favorable prognosis.
Some of the identified variables have previously been identified as univariable predictors for other musculoskeletal conditions, and some may be more unique to cervical radiculopathy [16, 23]. High initial pain intensity and a long duration of symptoms are known to be predictive of a poor recovery in various musculoskeletal disorders [16]. High levels of initial disability have been associated with poor recovery in musculoskeletal disorders [16] and lumbar radiculopathy [23]. For lumbar radiculopathy, sensory changes, including paresthesia, were not associated with outcome [23], whereas our study revealed that presence of paresthesia at baseline was associated with a lower chance of a poor perceived recovery. This seems counterintuitive. However, based on the finding that the presence of paresthesia decreased from 82% of patients at baseline to 42% at 12 months, one could argue that resolution of paresthesia may be an important factor in perceived recovery. The association between a larger active rotation toward the affected side and a reduced risk of persistent disability was in line with prior research indicating that movement restrictions are negative prognostic factors for musculoskeletal disorders [16].
It would have been informative to perform subgroup analyses based on type of nerve root compression (i.e., disk herniation, stenosis or a combination), or more specifically on the level, type and site of the disk herniation. However, we were unable to perform subgroup analyses because of the small dataset for these items. We recommend that the characteristics of the nerve root compression are taken into account in future research into the prognosis of cervical radiculopathy.
Study limitations
Our study has some limitations. Possible predictors were selected based on theoretical plausibility. Given the finite number of possible predictors that can be considered, we had to limit the selection to the most plausible predictors for each outcome variable. Since little is known about the prognostic factors for cervical radiculopathy, we made a priori assumptions about which predictors would be most valuable to determine the prognosis. We focused on possible predictors that were widely available to health practitioners in various settings. We therefore selected predominantly signs and symptoms as possible predictors. Including other factors, such as results from electrodiagnostic test or imaging, or psychosocial factors (e.g., anxiety and depression) may have yielded different results.
The nature of physiotherapy (e.g., type of exercises) and manual therapy (e.g., type of mobilization) were not recorded in detail. Hence, we cannot draw conclusions about the influence of different types of interventions on the prognosis. Given that studies of the effectiveness of physiotherapy and manual therapy in patients with cervical radiculopathy have shown comparable results, we assume that the influence of specific characteristics of the treatment on prognosis would be limited [5, 24].
To resolve the issue of missing data, we performed multiple imputations on the predictor variables with missing data and the outcome variables. Multiple imputation is used increasingly to account for missing data, and it is reported to be more valid than using complete-case analysis only [13, 25, 26].
Due to the strict diagnostic criteria we used for cervical radiculopathy, the number of patients we could recruit in the available time frame was smaller than anticipated. This resulted in a lower number of cases per event than preferred [13]. However, we accounted for possible overfitting by combining the multiple imputations with a strict bootstrap procedure [27]. In line with expectations, the bootstrap procedure showed a shrinkage factor of approximately 0.70 in all models. Consequently, the diagnostic accuracy and the explained variance were slightly lower in all models. Given the multiple imputation methods used and the internal validation procedure, we believe that these results adequately reflect the prognostic value of the models and correct for the optimism in the initial models. However, considering the smaller dataset to derive the models and the relatively large amount of missing data, it is important that these findings are validated in a larger external dataset. Until these prognostic models have been confirmed, the results should be interpreted with caution.
Conclusion
The clinical course of patients with cervical radiculopathy appears to be long, with only approximately half of the patients recovered at 6 and 12 months. A longer duration of symptoms, absence of paresthesia, a higher neck pain intensity at baseline, a higher baseline disability score and a lower active rotation toward the affected side were related to poor perceived recovery, poor relief of neck pain and/or disability. Confirmation of the prognostic models through external validation is necessary.
Notes
Acknowledgements
We thank Rob Epping for his contribution to the data collection.
Funding
This study was funded by the Scientific College for Physiotherapy of the Royal Dutch Society for Physiotherapy.
Compliance with ethical standards
Conflict of interest
The authors declare that they have no conflict of interest.
Supplementary material
References
-
1.Kuijper B, Tans JTJ, Schimsheimer RJ et al (2009) Degenerative cervical radiculopathy: diagnosis and conservative treatment. A review. Eur J Neurol 16:15–20. https://doi.org/10.1111/j.1468-1331.2008.02365.xCrossRefPubMedGoogle Scholar
-
2.Radhakrishnan K, Litchy WJ, O’Fallon WM, Kurland LT (1994) Epidemiology of cervical radiculopathy. A population-based study from Rochester, Minnesota, 1976 through 1990. Brain 117(Pt 2):325–335. https://doi.org/10.1093/brain/117.2.325CrossRefPubMedGoogle Scholar
-
3.Bono CM, Ghiselli G, Gilbert TJ et al (2011) An evidence-based clinical guideline for the diagnosis and treatment of cervical radiculopathy from degenerative disorders. Spine J 11:64–72. https://doi.org/10.1016/j.spinee.2010.10.023CrossRefPubMedGoogle Scholar
-
4.Thoomes EJ, Scholten-Peeters GGM, De Boer AJ et al (2012) Lack of uniform diagnostic criteria for cervical radiculopathy in conservative intervention studies: a systematic review. Eur Spine J 21:1459–1470. https://doi.org/10.1007/s00586-012-2297-9CrossRefPubMedPubMedCentralGoogle Scholar
-
5.Thoomes EJ, Scholten-Peeters W, Koes B et al (2013) The effectiveness of conservative treatment for patients with cervical radiculopathy: a systematic review. Clin J Pain 29:1073–1086. https://doi.org/10.1097/AJP.0b013e31828441fbCrossRefPubMedGoogle Scholar
-
6.Iyer S, Kim HJ (2016) Cervical radiculopathy. Curr Rev Musculoskelet Med 9:272–280. https://doi.org/10.1007/s12178-016-9349-4CrossRefPubMedPubMedCentralGoogle Scholar
-
7.Wong JJ, Côté P, Quesnele JJ et al (2014) The course and prognostic factors of symptomatic cervical disc herniation with radiculopathy: a systematic review of the literature. Spine J 14:1781–1789. https://doi.org/10.1016/j.spinee.2014.02.032CrossRefPubMedGoogle Scholar
-
8.Cleland JA, Fritz JM, Whitman JM, Heath R (2007) Predictors of short-term outcome in people with a clinical diagnosis of cervical radiculopathy. Phys Ther 87:1619–1632. https://doi.org/10.2522/ptj.20060287CrossRefPubMedGoogle Scholar
-
9.Kamper SJ, Ostelo RWJG, Knol DL et al (2010) Global Perceived Effect scales provided reliable assessments of health transition in people with musculoskeletal disorders, but ratings are strongly influenced by current status. J Clin Epidemiol 63:760–766. https://doi.org/10.1016/j.jclinepi.2009.09.009CrossRefPubMedGoogle Scholar
-
10.Williamson A, Hoggart B (2005) Pain:a review of three commonly used rating scales. J Clin Nurs 14:798–804. https://doi.org/10.1111/j.1365-2702.2005.01121.xCrossRefPubMedGoogle Scholar
-
11.Serlin R, Mendoza T, Nakamura Y et al (1995) When is cancer pain mild, moderate or severe? Grading pain severity by its interference with function. Pain 61:277–284CrossRefGoogle Scholar
-
12.Ostelo RWJG, Deyo RA, Stratford P et al (2008) Interpreting change scores for pain and functional status in low back pain. Spine (Phila Pa 1976) 33:90–94. https://doi.org/10.1097/brs.0b013e31815e3a10CrossRefGoogle Scholar
-
13.Moons KGM, Altman DG, Reitsma JB et al (2015) Transparent Reporting of a multivariable prediction model for Individual Prognosis Or Diagnosis (TRIPOD): explanation and Elaboration. Ann Intern Med 162:W1. https://doi.org/10.7326/M14-0698CrossRefPubMedGoogle Scholar
-
14.Collins GS, Reitsma JB, Altman DG, Moons KGMM (2015) Transparent reporting of a multivariable prediction model for Individual Prognosis Or Diagnosis (TRIPOD): the TRIPOD statement. Ann Intern Med 162:55–63. https://doi.org/10.7326/M14-0697CrossRefPubMedPubMedCentralGoogle Scholar
-
15.Bruls VEJ, Bastiaenen CHG, De Bie RA (2015) Prognostic factors of complaints of arm, neck, and/or shoulder: a systematic review of prospective cohort studies. Pain 156:765–788CrossRefGoogle Scholar
-
16.Artus M, Campbell P, Mallen CD et al (2017) Generic prognostic factors for musculoskeletal pain in primary care: a systematic review. Br Med J 7:e012901. https://doi.org/10.1136/bmjopen-2016-012901CrossRefGoogle Scholar
-
17.de Koning CHP, van den Heuvel SP, Staal JB et al (2008) Clinimetric evaluation of active range of motion measures in patients with non-specific neck pain: a systematic review. Eur Spine J 17:905–921. https://doi.org/10.1007/s00586-008-0656-3CrossRefPubMedPubMedCentralGoogle Scholar
-
18.Harris KD, Heer DM, Roy TC et al (2005) Reliability of a measurement of neck flexor muscle endurance. Phys Ther 85:1349–1355PubMedGoogle Scholar
-
19.Timmerman H, Wolff AP, Schreyer T et al (2013) Cross-cultural adaptation to the Dutch language of the pain DETECT-Questionnaire. Pain Pr 13:206–214CrossRefGoogle Scholar
-
20.White IR, Wood AM (2011) Multiple imputation using chained equations: issues and guidance for practice. Stat Med 30:377–399. https://doi.org/10.1002/sim.4067CrossRefPubMedGoogle Scholar
-
21.Steyerberg EW, Eijkemans MJC, Harrell FE Jr (2001) Prognostic modeling with logistic regression analysis: search of a sensible strategy in small data sets. Med Decis Mak 21:45–56CrossRefGoogle Scholar
-
22.Terwee CB, Bot SDM, de Boer MR et al (2007) Quality criteria were proposed for measurement properties of health status questionnaires. J Clin Epidemiol 60:34–42. https://doi.org/10.1016/j.jclinepi.2006.03.012CrossRefGoogle Scholar
-
23.Verwoerd AJH, Luijsterburg PAJ, Lin CWC et al (2013) Systematic review of prognostic factors predicting outcome in non-surgically treated patients with sciatica. Eur J Pain 17:1126–1137. https://doi.org/10.1002/j.1532-2149.2013.00301.xCrossRefPubMedGoogle Scholar
-
24.Kjaer P, Kongsted A, Hartvigsen J, et al (2017) National clinical guidelines for non-surgical treatment of patients with recent onset low back pain or lumbar radiculopathy. Eur Spine J https://doi.org/10.1007/s00586-017-5099-2CrossRefGoogle Scholar
-
25.Heymans MW, Van Buuren S, Knol DL et al (2007) Variable selection under multiple imputation using the bootstrap in a prognostic study. 11:1–11. https://doi.org/10.1186/1471-2288-7-33CrossRefGoogle Scholar
-
26.Hayati Rezvan P, Lee KJ, Simpson JA (2015) The rise of multiple imputation: a review of the reporting and implementation of the method in medical research. BMC Med Res Methodol 15:30. https://doi.org/10.1186/s12874-015-0022-1CrossRefPubMedPubMedCentralGoogle Scholar
-
27.Steyerberg EW, Bleeker SE, Moll HA et al (2003) Internal and external validation of predictive models: a simulation study of bias and precision in small samples. J Clin Epidemiol 56:441–447. https://doi.org/10.1016/S0895-4356(03)00047-7CrossRefPubMedGoogle Scholar
Copyright information
Open AccessThis article is distributed under the terms of the Creative Commons Attribution 4.0 International License (http://creativecommons.org/licenses/by/4.0/), which permits unrestricted use, distribution, and reproduction in any medium, provided you give appropriate credit to the original author(s) and the source, provide a link to the Creative Commons license, and indicate if changes were made.