The aims of this study were (1) to determine the prevalence of radiographic cervical disc degeneration in a large population of patients aged from 18 to 97 years; (2) to investigate individually the prevalence and distribution of height loss, osteophyte formation, endplate sclerosis and spondylolisthesis; and (3) to describe the patterns of cervical disc degeneration.
A retrospective study was performed. Standard lateral cervical spine radiographs in standing, neutral position of 1581 consecutive patients (723 males, 858 females) with an average age of 41.2 ± 18.2 years were evaluated. Cervical disc degeneration was graded from C2/C3 to C6/C7 based on a validated quantitative grading system. The prevalence and distribution of radiographic findings were evaluated and associations with age were investigated.
53.9% of individuals had radiographic disc degeneration and the most affected level was C5/C6. The presence and severity of disc degeneration were found to be significantly associated with age both in male and female subjects. The most frequent and severe occurrences of height loss, osteophyte formation, and endplate sclerosis were at C5/C6, whereas spondylolisthesis was most observed at C4/C5. Age was significantly correlated with radiographic degenerative findings. Contiguous levels degeneration pattern was more likely found than skipped level degeneration. The number of degenerated levels was also associated with age.
The presence and severity of radiographic disc degeneration increased with aging in the cervical spine. Older age was associated with greater number of degenerated disc levels. Furthermore, the correlations between age and the degree of degenerative findings were stronger at C5/C6 and C6/C7 than at other cervical spinal levels.
Cervical intervertebral disc degeneration is one of the most relevant clinical findings which can be extracted from cervical plain radiographs (i.e. X-rays) and has been described before both in symptomatic and asymptomatic people [1,2,3,4,5,6,7,8,9,10,11]. Although degeneration is most commonly assessed on magnetic resonance imaging (MRI), conventional plain radiography has several advantages over this imaging modality, such as cost-effectiveness, simplicity, as well as the capability of acquiring cervical sagittal alignment under weight-bearing conditions [12, 13]. Indeed, Oshina et al. [14] recommended that standing cervical lateral radiographs should be obtained for all patients before surgery, since the cervical sagittal alignment in the standing posture is essential for the pre-operative planning, but is not accessible by means of other imaging modalities such as computed tomography (CT) and MRI.
Knowledge of the characteristics of cervical disc degeneration based on plain radiographs may have relevant implications. For example, it would be helpful to assess the relation between the cervical disc degeneration and clinical symptoms (e.g. neck pain) [11, 15, 16] or the effect of disc degeneration on spinal kinematics [17]. Additionally, radiographic degenerative phenotypes such as disc height loss, osteophyte formation or endplate sclerosis have been applied widely for diagnosis of the adjacent segment degeneration/disease following anterior cervical decompression and fusion [18,19,20,21,22]. Therefore, given the importance of radiographic disc degeneration to be used as a clinical reference, a better and more precise understanding of the characteristics of cervical disc degeneration based on plain radiographs is essential.
Based on cervical lateral x-ray images, several scoring schemes for cervical disc degeneration have been reported [6, 9, 10, 23,24,25,26]. In 1957, Kellgren and Lawrence proposed [10] a grading system in which the degenerative condition was graded as ‘‘minimal”, ‘‘moderate’’ or ‘‘severe’’. In a subsequent study, Gore et al. [6] introduced a more sophisticated grading system that includes specific parameters, such as disc height loss, endplate sclerosis, and osteophyte formation and investigated the prevalence of degenerative changes in 200 asymptomatic people aged 20–65 years. In 2006, Kettler et al. [25] introduced a numerical scoring system for cervical disc degeneration based on lateral radiographs, which was not only substantial for the overall degree of disc degeneration, but also almost perfect for the single items.
However, to our knowledge, there has been no study that investigated precisely and comprehensively cervical disc degeneration on plain radiographic data, especially the detailed incidence, location and severity of the individual degenerative phenotype in a much larger population of patients with a wider age range. Therefore, the aims of this study were (1) to determine the prevalence of the radiographic cervical disc degeneration in a large sample and its relationship with age, (2) to investigate in detail the prevalence and distribution features of height loss, osteophyte formation, endplate sclerosis and spondylolisthesis, (3) to describe the radiographic patterns of disc degeneration in the cervical spine.
A retrospective study was performed. A total of 2866 consecutive plain sagittal radiographs of the cervical spine acquired between 2016 and 2019 at the University Hospital if Ulm were initially included in the study. Exclusion criteria included: (1) younger than 18 years; (2) with previous cervical spinal surgery; (3) radiographs showing evidence of ankylosing spondylitis, congenital spinal anomalies, tumours or vertebral fractures. Furthermore, only subject with radiographs with all the cervical disc spaces from C2/C3 to C6/C7 clearly visualized on standard neutral lateral radiographs were included in the current research. After screening of all radiographs by the first author, a total of 1581 subjects (7905 intervertebral discs) were evaluated in this study. The average patient age was 41.2 ± 18.2 years (range 18–97 years), with 723 males and 858 females (Table 1). Sex and age of all subjects were noted. This radiographic study was approved by the ethical committee board of the University Hospital in Ulm (No. 50/20).Table 1 The distribution of subjects in each age groupFull size table
Cervical disc levels from C2/C3 to C6/C7 were investigated on lateral, standing neutral plain radiographs of each subject. The quantitative assessment for the presence and severity of cervical disc degeneration was based on Kettler’s grading system [25], extended to cover also spondylolisthesis and patterns of disc degeneration. All the radiographic assessments were performed by one of the authors (an experienced spine surgeon). In brief, the grading system consists of three variables: ‘‘Height loss’’, ‘‘Osteophyte formation’’, and ‘‘Endplate sclerosis’’, each graded on a scale from 0 to 3. The overall degree of degeneration for each intervertebral disc of the cervical spine is then determined by summing the three scores, and classified as follow: Grade 0 (score 0, no degeneration), Grade 1 (score 1–3, mild degeneration), Grade 2 (score 4–6, moderate degeneration) and Grade 3 (score 7–9, severe degeneration).
In the current study, the existence and severity of disc height loss, osteophyte formation and endplate sclerosis were evaluated according to Kettler’s grading scheme [25]. Disc height loss was classified as “normal” if there was no height loss; “minimal narrowing”, if less than 30% decrease in disc height; “moderate narrowing”, if the decrease of disc height was more than 33% but less than 66%, and “severe narrowing” if the decrease of disc height was more than 66%. For the size of osteophyte formation, if the osteophyte length was less than 2 mm it was noted as “small”; more than 2 mm but less than 4 mm, noted as “moderate”; if more than 4 mm, noted as “large”. The location of osteophyte formation was evaluated on the four corners of the intervertebral disc, including two anterior (anterior-upper, anterior-lower) and two posterior (posterior-upper, posterior-lower) locations. In this paper, osteophytes were conventionally named with respect to the disc, e.g. a superior osteophyte refers to the inferior aspect of the cranial vertebra of each motion segment. The degree and location (cranial or caudal to the intervertebral disc) of endplate sclerosis were also evaluated, if there was no sclerosis it was recorded 0 points, 1/2 partially or completely affected, recorded as 1 point and more than 1/2 partially or completely affected, recorded as 2 points. Cervical intervertebral disc degeneration was graded independently from C2/C3 to C6/C7, and then the severity degree of degeneration for each subject was determined at the severest intervertebral level, as done in a previous study [15].
In addition, to identify patterns of cervical radiographic disc degeneration, all subjects with disc degeneration were further stratified into three patterns: ‘‘Solitary-level disc degeneration’’, if disc degeneration affected only one single level; ‘‘Contiguous levels disc degeneration’’, if there were two or more contiguous levels with disc degeneration and ‘‘Skipped level disc degeneration (noncontiguous)’’ if the individuals with 2 or more levels of disc degeneration had non-degenerated discs in-between degenerated levels, according to previous studies in the lumbar spine [27,28,29]. Furthermore, the total number of levels with disc degeneration was counted for each subject (with a range of one level to five levels), regardless of the severity and location of disc degeneration.
Spondylolisthesis (anterolisthesis and retrolisthesis) was noted as ‘‘present’’ or “absent” for each subject and intervertebral disc level and was defined as 2 mm or more vertebra slippage of the cranial vertebra on the caudal vertebra in the anterior or posterior direction [30,31,32,33,34,35,36,37]. The slippage distance was measured from the poster inferior corner of the cranial vertebra to the tangential line along the posterior border of the caudal vertebra. To prevent the possible errors due to the presence of osteophytes, the distance from the posterior border of the caudal vertebral body to the corner parallel to the posterior border of cranial vertebral body was measured, as described in previous studies [38, 39]. To assess the intra-rater reliability of spondylolisthesis measurements, 100 cervical disc levels in 20 patients with spondylolisthesis was repeated one week later by the same observer. An intraclass correlation coefficient (ICC) of 0.98 was calculated.
Descriptive and frequency statistics were estimated to evaluate the prevalence and distribution of degenerative findings. The differences between 2 independent groups were compared with Mann–Whitney U test. Fisher’s exact test was used to analyze the prevalence of radiographic findings. Spearman’s rank correlation coefficient was used to investigate the relationship between age and the severity of the degenerative radiographic findings as well as the number of disc degeneration levels. The associations between age and the presence of the radiographic findings were investigated by binary logistic regression analysis, with age as the independent variable and the radiographic findings being as the dependent variables. The strength of the correlation was classified as negligible (0.00–0.10), weak correlation (0.10–0.39), moderate (0.40–0.69), strong correlation (0.70–0.89), very strong correlation (0.90–1.00) [40]. The statistical analyses were performed by GraphPad Prism version 8.4.2 for windows (San Diego, CA, USA) and statistical significance was set at p < 0.05.
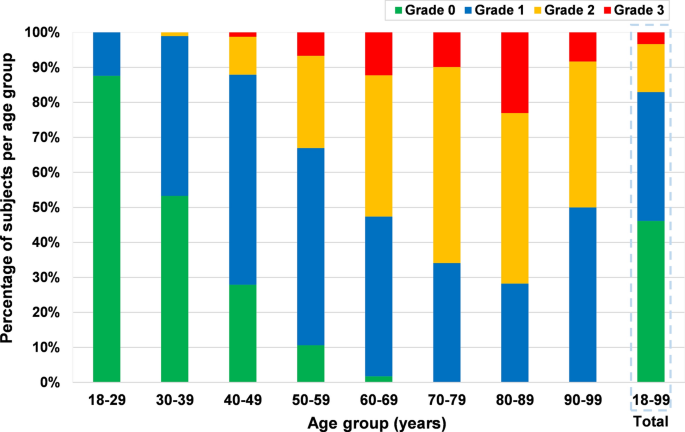
Generally, 53.9% (n = 852; 386 males, 466 females; mean age = 52.3 ± 16.6 years) of all the subjects presented with radiographic cervical disc degeneration, and the prevalence of disc degeneration was not significantly different between males and females (53.4 vs. 54.3%, p = 0.72). 36.8% of the subjects had Grade 1 (mild degeneration) disc degeneration, 13.7% had Grade 2 (moderate degeneration) and 3.4% had Grade 3 (severe degeneration). In the age group of 18–29 years, 12.4% of the patients had disc degeneration, the prevalence increased to 46.7% in the 30–39 years age group and 98.2% in the age group of 60–69 years. All the patients over 70 years had disc degeneration. All the patients with disc degeneration in the age group of 18–29 had only mild disc degeneration (Grade 1). There was no patient with severe degeneration (Grade 3) below 40 years of age (Fig. 1).
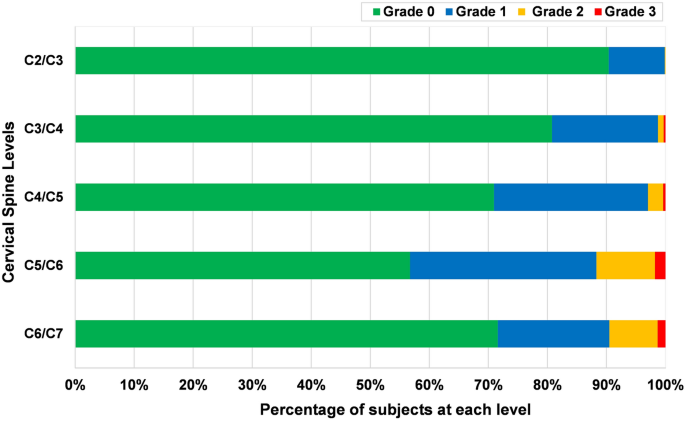
The most affected level was found to be C5/C6 (43.3%), and the least affected was C2/C3 (9.6%). Cervical disc degeneration of grades 2 and 3 were most common at C5/C6 followed by C6/C7 and C4/C5; there was no severe disc degeneration at C2/C3 (Fig. 2). There was no statistical significant difference between males and females in respect of the prevalence of disc level degeneration, except for at the C3/C4 level (22.0 in males vs 17.0% in females, p = 0.01).
In logistic regression analysis, the presence of disc level degeneration was found to be significantly associated with greater age among all patients [odds ratio (OR) 1.15 for each additional year; 95% confidence interval (CI), 1.13–1.16; p < 0.0001], the associations were similar in males (OR 1.15; 95% CI, 1.13–1.18; p< 0.0001) and female (OR 1.14; 95% CI, 1.12–1.16; p < 0.0001). As presented in Table 2, greater age was significantly associated with the presence of disc degeneration at all disc levels (p < 0.0001).Table 2 Results of logistic regression analysis of association between age and the presence of radiographic findings at each level (n = 1581)Full size table
Spearman’s rank correlation coefficient test demonstrated that there were strong positive correlations between age and severity of disc degeneration among all subjects (rs = 0.74; 95% CI, 0.71–0.76; p < 0.0001), and were similar in males (rs = 0.74; 95% CI, 0.71–0.77; p < 0.0001) and females (rs = 0.71; 95% CI, 0.67–0.74; p < 0.0001). There was no significant difference between the average severity score of the disc degeneration between male and female subjects (p = 0.72). As shown in Table 3, there was strong statistical correlation between age and severity of disc level degeneration at C5/C6; moderate correlations at C3/C4, C4/C5 and C6/C7; and only weak correlation at C2/C3.Table 3 Spearman’s rank correlation coefficient (rs) between age and the severity of radiographic findings at each level (Males = 723, Females = 858)Full size table
Overall, regardless of the severity and location, 44.2% (699/1581) of the patients had signs of height loss, 47.3% (748/1581) had osteophyte formation and 14.3% (226/1581) had endplate sclerosis. There were no significant differences between males and females in terms of the overall prevalence of height loss (42.3 vs 45.8%, p = 0.17), osteophyte formation (47.2 vs 47.4%, p = 0.92) and endplate sclerosis (14.0 vs 14.6%, p = 0.77). Greater age was significantly associated with the presence of height loss (OR 1.12; 95% CI, 1.11–1.13; p < 0.0001), osteophyte formation (OR 1.15; 95% CI, 1.14–1.17; p < 0.0001) and endplate sclerosis (OR 1.10; 95% CI, 1.08–1.11; p < 0.0001), respectively.
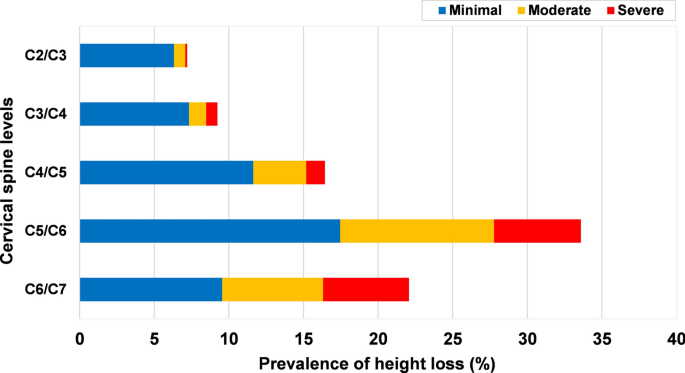
Height loss was most frequent at the level C5/C6 (33.6%), followed by C6/C7 (22.1%) (Fig. 3). Moderate and severe were more commonly seen at C5/C6 and C6/C7 (Fig. 4). The prevalence of height loss was significantly higher in males than in females at C3/C4 (p = 0.04), whereas significantly lower in males than in females at C5/C6 (p = 0.02). In the age group of 18–29 years, 8.3% patients had height loss, the rate increased to 57.5% in the age group of 40–49 years and 78.0% in the 50–59 years age group (Fig. 5).
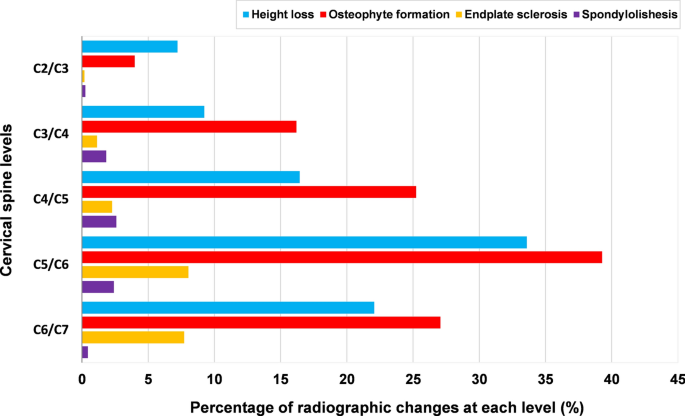
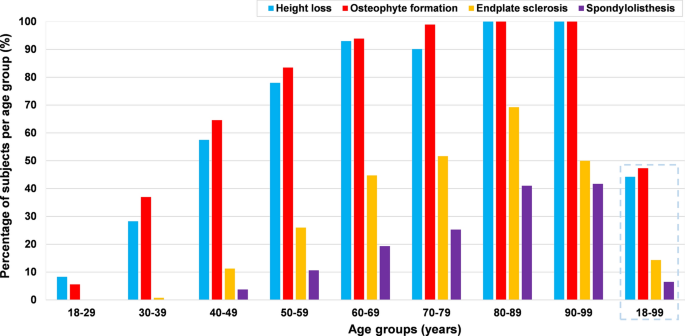
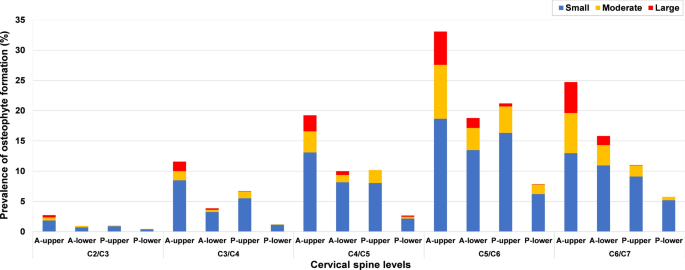
Osteophyte formation was most frequent at C5/C6 (39.2%), C6/C7 (27.1%) was the second most affected level, while C2/C3 (4%) was least affected (Fig. 3). Moderate and large osteophytes were more commonly seen at C5/C6 and C6/C7 (Fig. 6). The prevalence of osteophytes at C2/C3 (anterior-upper and lower, posterior-upper) and C3/C4 (anterior-lower and posterior-upper) was significantly higher in males than in females. Except for at C2/C3, the prevalence and average severity score of anterior osteophytes were significantly higher than that of posterior ones, the prevalence and mean severity score of superior osteophytes were also significantly higher than that of inferior osteophytes (p < 0.0001). The anterior-upper corner of C5/C6 was most frequently affected, while the posterior-lower corner of C2/C3 was least affected (Fig. 6). In the age group of 18–29 years, 5.6% patients had osteophyte formation and their prevalence increased to 64.6% in the age group of 40–49 years and to 83.5% in the 50–59 years age group (Fig. 5).
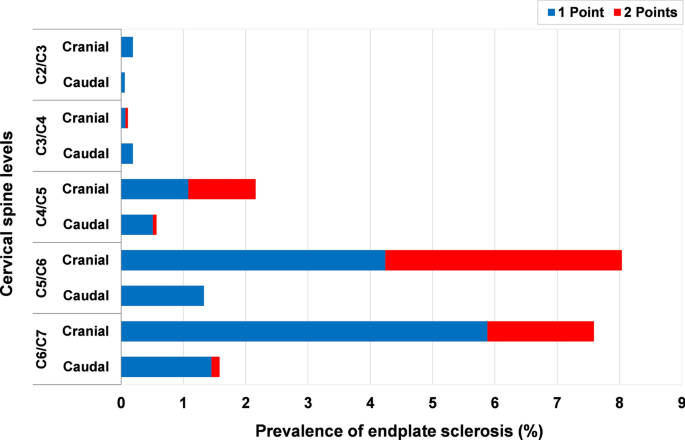
Endplate sclerosis was also most frequently found at C5/C6 (8.0%) and C6/C7 (7.7%); the lowest prevalence was at C2/C3 (0.2%) (Fig. 3). Endplate sclerosis with 2 points was more commonly found at C5/C6 and C6/C7 (Fig. 7). The prevalence of endplate sclerosis on the cranial endplate was significantly higher in males than in females at C3/C4 level. The prevalence and average severity score of cranial endplate sclerosis was significantly higher than that of caudal (p < 0.001), except at C2/C3. There was no endplate sclerosis in the age group of 18–29 years and only 0.7% in the age group of 30–39 years, whereas 26.0% of the patients in the 50–59 years age group were affected (Fig. 5).
Spondylolisthesis was found at 117 levels in 102 patients (102/1581, 6.5%) and most frequently observed at the level C4/C5 (Figs. 3, 5), including 39 subjects (2.5%) who had anterolisthesis, 61 subjects (3.9%) who had retrolisthesis and 2 subjects (0.1%) who had both anterolisthesis and retrolisthesis at different spinal levels. Among 117 levels with spondylolisthesis, anterior slip at 46 levels (39.3%) and posterior slip at 71 levels (60.7%) were observed; the most common involved levels were C4/C5 in anterolisthesis (18/46, 39.1%) and C5/C6 in retrolisthesis (28/71, 39.4%), respectively. 87.2% of the 102 patients had olisthesis at one level, 10.8% at 2 levels and 2.0% at 3 levels. Greater age was also significantly associated with the presence of spondylolisthesis (OR 1.08; 95% CI, 1.07–1.10; p < 0.0001). The overall prevalence of spondylolisthesis is similar between males and females (5.8 vs 7.0%, p = 0.36). At the level C5/C6, prevalence of spondylolisthesis was significantly higher in females than in males. Spondylolisthesis was not seen under 40 years of age. In the age group of 40–49 years, 3.8% of the patients had signs of spondylolisthesis and the rate rose to 10.6% in the 50–59 years age group (Fig. 5).
Detailed results of association between age and the presence of different degenerative radiographic findings at each cervical disc level are presented in Table 2. Correlations (Spearman r) between age and severity of individual radiographic findings are presented in Table 3.
There was a strong statistically significant correlation between age and the number of degenerated levels (rs = 0.77; 95% CI, 0.74–0.79; p < 0.0001). Similar correlations were found in males (rs = 0.76; 95% CI, 0.73–0.79; p < 0.0001) and females (rs = 0.77; 95% CI, 0.74–0.80; p < 0.0001).
Among the 852 subjects with cervical disc degeneration, 34.5% (294/852) of subjects had one level degeneration, whereas 65.5% (558/852) of the patients presented multilevel disc degeneration, including 20.4% at 2 levels, 20.8% at 3 levels, 19.0% at 4 levels and 5.3% at 5 levels. The average number of levels with disc degeneration was 2.4 (range 1–5), and was not statistically different in males and females (2.5 vs 2.3, p = 0.07). The number of degenerated levels per age group is presented in Fig. 8.
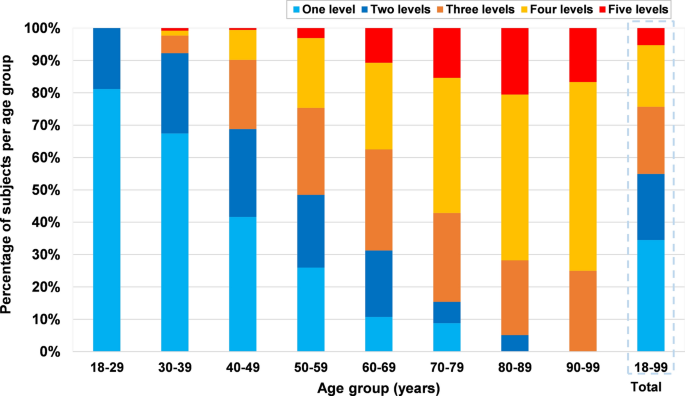
Overall, contiguous levels disc degeneration was the most common pattern (n = 453, 53.2%), followed by solitary-level disc degeneration (n = 294, 34.5%) and skipped level degeneration (n = 105, 12.3%) (Fig. 9). The presence of contiguous levels degeneration increased significantly with age (p < 0.0001). Over the age of 40 years, more than 50% of patients with degeneration had contiguous levels degeneration per age group. The detailed prevalence and distribution of disc degeneration patterns are shown in Table 4.
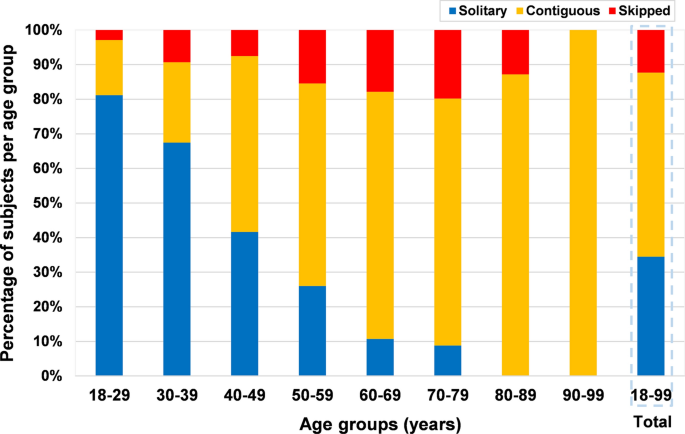
Table 4 The prevalence and distribution of disc degeneration patterns in the cervical spineFull size table
Our data demonstrated that age-related change of cervical disc degeneration is very common and most frequently observed at C5/C6, consistent with several previous studies [2, 5, 6, 41, 42]. Despite radiographic cervical disc degeneration having been widely investigated, its impact on clinical symptoms remains uncertain [2, 4, 7, 9, 11, 15, 16, 43, 44]. One of the reasons may be the lack of accurate assessment of the incidence or severity of radiographic disc degeneration, or detailed location and degree of the radiographic degenerative changes. Marchiori et al. [11] found that the number of radiographic degeneration levels was significantly associated with the chronicity of cervical complaints (Neck Disability Index scores). Gore et al. [8] found that the initial radiographic degeneration at C6/C7 significantly predicted the development of pain. Recently, Harada et al. [45] reported that the global degree of degeneration of the motion segment on MRI may be more clinically relevant than individual phenotypes. In fact, the available data are relatively inconsistent and do not allow for a deep understanding of cervical disc degeneration and its clinical implications; the relationships between cervical disc degeneration, its radiographic signs, and its clinical significance in terms of pain and dysfunction are still largely unknown and constitute an area of active research. We believe that the comprehensive data reported in this paper can support and improve our understanding of cervical disc degeneration, and can foster further research addressing the clinical consequences of radiological degenerative findings.
Our current results showed that the height loss and osteophyte formation were more common than endplate sclerosis; the most frequent and severe occurrences of these three radiographic degenerative phenotypes were at C5/C6, followed by C6/C7 and C4/C5. Moreover, the presence and severity of these degenerative changes were significantly associated with age. These findings are generally consistent with previous studies [6, 7]. Additionally, anterior osteophytes were seen more frequently and were larger size than that of posterior ones, the superior osteophytes were also seen more frequently than that of inferior osteophytes (with respect to disc level in the current study). Similar findings were found in previous studies [3, 46, 47]. With regard to cervical spondylolisthesis, the overall prevalence has been reported previously to be 3.9–28.2%, and was mostly found at C4/C5 [35, 36, 39, 48,49,50]; the prevalence of anterior spondylolisthesis ranged from 0.9 to 6.3%, and of posterior spondylolisthesis from 0 to 13.3% [35,36,37,38,39, 49, 50]. Similarly, the current results showed that the overall prevalence of cervical spondylolisthesis was 6.5% (also mostly found at C4/C5); the prevalence of anterior and posterior spondylolisthesis was 2.5 and 3.9%, respectively. Furthermore, we also found that the prevalence of spondylolisthesis was correlated with age, as described in a previous study [3].
Interestingly, although our data also demonstrated that the degree of disc level degeneration and those three degenerative changes were significantly associated with age, our data revealed that the correlations (Spearman r) were different among the cervical spinal regions (Table 3). For example, a strong correlation was found between age and the degree of disc degeneration at C5/C6; moderate correlations were found at C3/C4, C4/C5 and C6/C7; only a weak correlation was found at C2/C3. Regarding the degenerative changes, for instance, moderate correlations were found between age and the degree of height loss at C5/C6, C6/C7 and C4/C5 (females), whereas only weak correlations were found at C2/C3 and C3/C4. However, because of the cross-sectional nature of the present research, these findings need further longitudinal studies, which may provide additional detail information.
In addition, we described in detail the prevalence and distribution features of radiographic patterns of cervical disc degeneration (Fig. 9, Table 4). In the current study, the presence of contiguous levels degeneration pattern significantly associated with greater age. Contiguous levels degeneration pattern was more frequent than skipped level degeneration (53.2 vs.12.3%). Suzuki et al. [42] also found that the prevalence of skipped level of cervical disc degeneration was significantly lower than contiguous disc degeneration. Although the clinical consequences of the different patterns of disc degeneration were never investigated in the cervical spine, their relevance has been demonstrated in the lumbar spine [27,28,29]. A previous study [28] demonstrated that different patterns of lumbar disc degeneration may exhibit various clinical symptoms, and the individuals with contiguous multilevel disc degeneration were more likely to suffer from severe low back pain than those with skipped level disc degeneration. Although specific radiographic degeneration patterns may have different effects of on the clinical symptoms, the current findings cannot shed light on this association since clinical data were not collected. The issue remains indeed relatively unexplored, and further studies about the clinical impact of radiographic disc degeneration patterns in cervical spine are thus needed.
There are several potential limitations in the present study. First, the current study has a retrospective design and focused only on radiographic evidence of cervical disc degeneration. Clinical data such as the degree of pain was not available, and therefore the relationship between the cervical disc degeneration and the clinical symptoms was not investigated. Second, there was no ethnic record in the present study and images database was acquired from a single institute; as a matter of fact, the ethnic difference of the degenerative changes in the cervical spine should be taken into consideration to determine if our findings are globally generalizable [46, 47]. Third, other factors which may affect cervical disc degeneration, such as smoking [51, 52], muscle strength [53] or biochemical data [54], were not collected. Fourth, we did not investigate the associations between radiographic degenerative changes and other radiographic parameters in the cervical spine, such as the impact of posterior osteophytes on spinal canal diameter [55], or the associations between degenerative changes and cervical sagittal alignment [56]. Last but not least, the number of subjects aged more than 70 years was relatively small.
Despite these limitations, we believe that results of the current research will improve the understanding of the features of cervical disc degeneration on plain radiographs, and may be utilized as baseline data for future studies.
Our study found that 53.9% of all patients had radiographic disc degeneration in the cervical spine, with a predominance of Grade 1 degeneration (36.8%). The most commonly and severely affected level was C5/C6. The most frequent and severe occurrences of height loss, osteophyte formation, and endplate sclerosis were at C5/C6 followed by C6/C7, whereas spondylolisthesis was most found at the level C4/C5. Our results reconfirmed that aging was associated with both the individual radiographic degenerative changes in the cervical spine as well as the number of degenerated segments.
Open Access funding enabled and organized by Projekt DEAL.
Correspondence to Hans-Joachim Wilke.
The authors of this study declare that they have no conflict of interest to disclose.
Springer Nature remains neutral with regard to jurisdictional claims in published maps and institutional affiliations.
Open Access This article is licensed under a Creative Commons Attribution 4.0 International License, which permits use, sharing, adaptation, distribution and reproduction in any medium or format, as long as you give appropriate credit to the original author(s) and the source, provide a link to the Creative Commons licence, and indicate if changes were made. The images or other third party material in this article are included in the article’s Creative Commons licence, unless indicated otherwise in a credit line to the material. If material is not included in the article’s Creative Commons licence and your intended use is not permitted by statutory regulation or exceeds the permitted use, you will need to obtain permission directly from the copyright holder. To view a copy of this licence, visit http://creativecommons.org/licenses/by/4.0/.