An excessive amount of total hospitalization is caused by delays due to patients waiting to be placed in a rehabilitation facility or skilled nursing facility (RF/SNF). An accurate preoperative prediction of who would need a RF/SNF place after surgery could reduce costs and allow more efficient organizational planning. We aimed to develop a machine learning algorithm that predicts non-home discharge after elective surgery for lumbar spinal stenosis.
We used the American College of Surgeons National Surgical Quality Improvement Program to select patient that underwent elective surgery for lumbar spinal stenosis between 2009 and 2016. The primary outcome measure for the algorithm was non-home discharge. Four machine learning algorithms were developed to predict non-home discharge. Performance of the algorithms was measured with discrimination, calibration, and an overall performance score.
We included 28,600 patients with a median age of 67 (interquartile range 58–74). The non-home discharge rate was 18.2%. Our final model consisted of the following variables: age, sex, body mass index, diabetes, functional status, ASA class, level, fusion, preoperative hematocrit, and preoperative serum creatinine. The neural network was the best model based on discrimination (c-statistic = 0.751), calibration (slope = 0.933; intercept = 0.037), and overall performance (Brier score = 0.131).
A machine learning algorithm is able to predict discharge placement after surgery for lumbar spinal stenosis with both good discrimination and calibration. Implementing this type of algorithm in clinical practice could avert risks associated with delayed discharge and lower costs.
These slides can be retrieved under Electronic Supplementary Material.
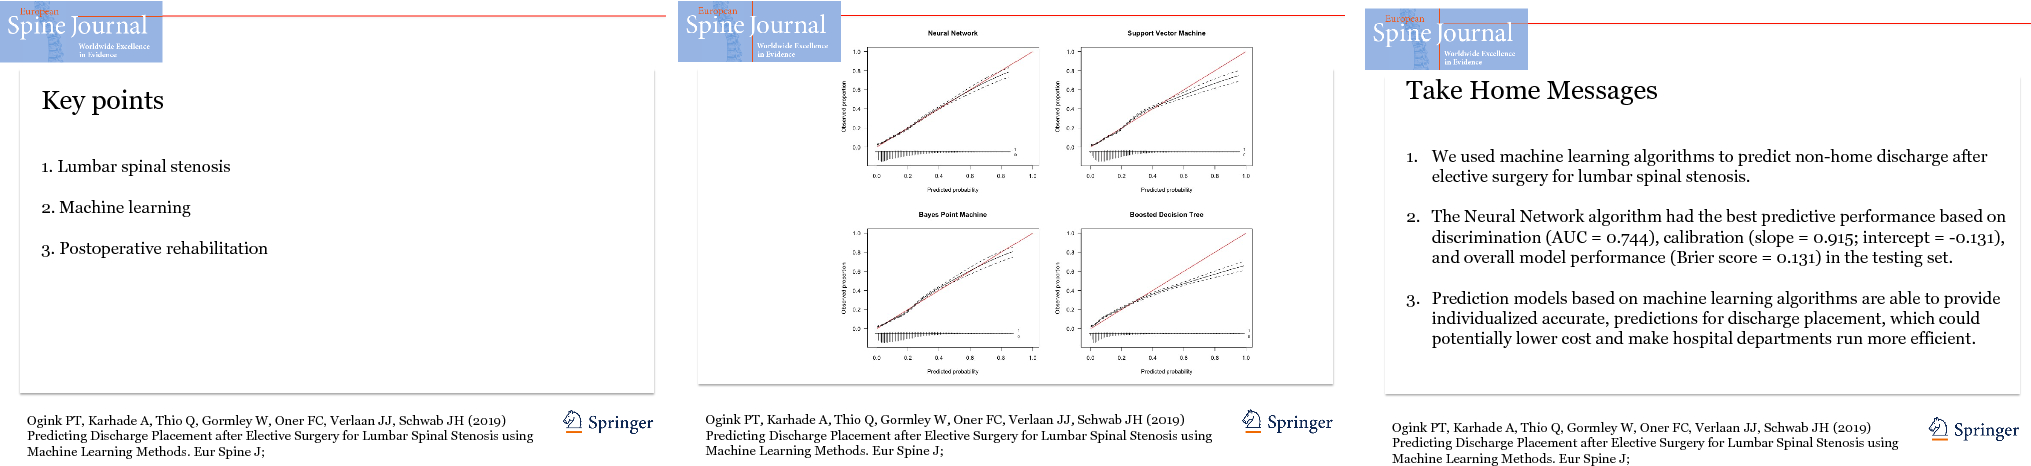
Spinal stenosis Machine learning Discharge placement Rehabilitation Calibration
The online version of this article ( https://doi.org/10.1007/s00586-019-05928-z) contains supplementary material, which is available to authorized users.
In recent years, there has been a trend toward quicker discharges after orthopedic surgery, which does not seem to affect patients’ outcomes inordinately [1, 2]. However, an excessive amount of total hospitalization is caused by delays due to patients waiting to be placed in a rehabilitation facility or skilled nursing facility (RF/SNF) [3, 4, 5, 6, 7, 8]. Not only does this incur unnecessary costs and hamper efficient delivery of care, but more importantly delayed discharges are detrimental to the patient [9]. Increased length of stay has been associated with hospital acquired infections and adverse drug events [7, 9, 10, 11]. Although increasing the number of facilities seems the obvious solution, a study by Gaughan et al. [12] found that this would only have a small effect on delayed discharges and would actually cost more.
Previous studies have determined risk factors for non-home discharge placement. Some have developed scoring systems based on these risk factors aiming to predict who will likely not be discharged home after spine surgery [13, 14, 15, 16]. However, no studies have looked at employing machine learning (ML) algorithms. The increased amounts of available data combined with more computational hardware are currently causing a rapid expansion of ML in medicine. ML is a form of artificial intelligence which allows algorithms to learn and self-improve from experience without explicit programming by a data scientist. The capacity of these algorithms to handle large datasets and incorporate nonlinear interactions allows for more accurate and personalized prediction than regular statistical methods.
An accurate personal preoperative prediction of who would need a RF/SNF place would allow reservation of a place in advance and earlier insurance precertification. This could reduce costs and avoid the risks of (unnecessary) prolonged hospitalization.
Lumbar spinal stenosis is a relatively common degenerative spine condition for which the SPORT trial has indicated surgical treatment to be superior to non-surgical treatment. Currently, it is one of the most common indications for spine surgery [17, 18].
In this study, we aim to develop a prediction tool using ML algorithms to predict discharge to a RF/SNF after elective surgery for lumbar spinal stenosis for patients living at home preoperatively. Second, we aim to select the best performing algorithm and develop an application to enable healthcare providers to arrange a place in a RF/SNF well in advance.
We used the American College of Surgeons National Surgical Quality Improvement Program (ACS-NSQIP) as our main data source. The ACS-NSQIP is a large clinical database with data of more than 680 US hospitals combined and has often been used in the spine literature.
We included patients based on the following criteria: (1) International Classification of Disease—Ninth Revision (ICD-9) code 724.02 or 724.03 for lumbar spinal stenosis; (2) year of surgery between 2009 and 2016; (3) Current Procedural Terminology (CPT) codes for decompression, fusion, or fixation. We included 28,600 patients in our dataset to train and test the algorithms.
Our primary outcome measure was non-home discharge defined as all discharges not to home. This variable was created by grouping together discharges to rehabilitation facilities, skilled nursing facilities, and unskilled nursing facilities. Variable selection for our algorithm was performed by entering all available variables in a random forest regression, which then ranks variables according to their predictive power for the outcome variable [19].
We performed a stratified 80:20 split of the dataset into a training set and a testing set. We used the training set for algorithm training and assessment of performance by tenfold cross-validation. Cross-validation means dividing the data into a selected number of groups, named folds. Each fold is withheld once and treated as the test set, while the other folds together are treated as the training set. Results are subsequently averaged across all repetitions of this sequence [20].
Four different algorithms (neural network, support vector machine, Bayes point machine, boosted decision tree) were trained using these variables to predict non-home discharge. We choose these four because they each have different merits for prediction (Appendix 1). Senders et al. [20] provide an accessible overview of the most commonly used algorithms. The model with the best performance was subsequently used in the testing set to predict discharge placement. These predictions were then compared with the actual outcomes of the testing set to assess the performance of the algorithm outside of the training set.
Performance of the algorithms was measured with discrimination, calibration, and an overall performance score [21, 22].
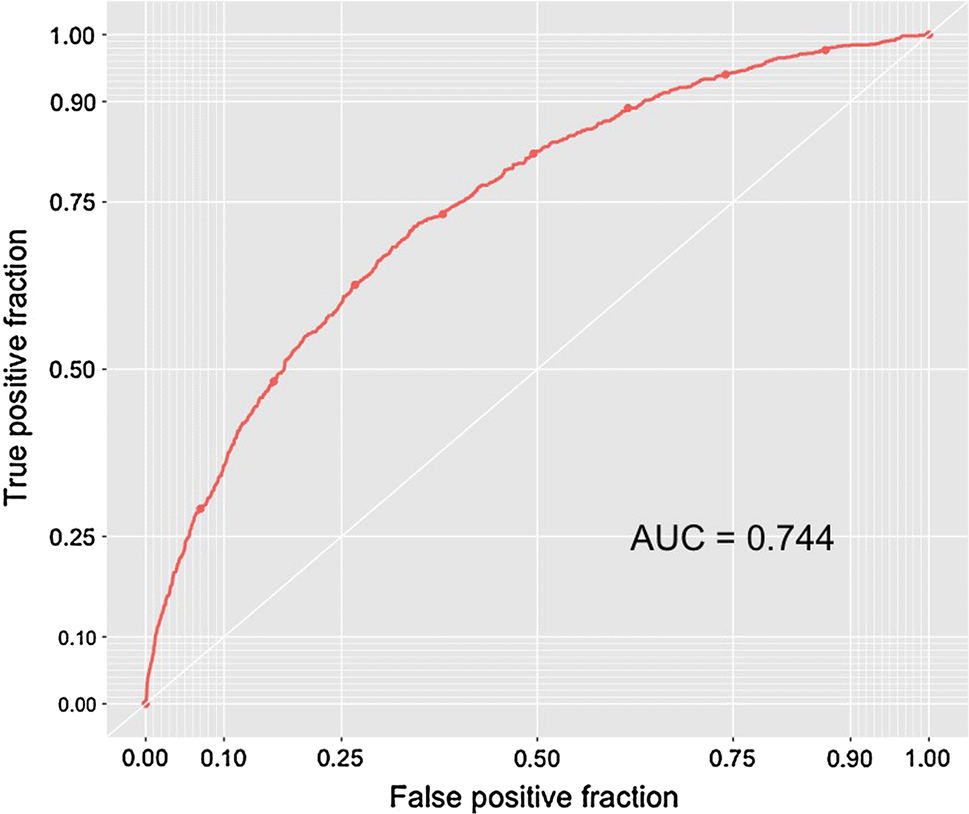
Discrimination is the algorithm’s ability to distinguish patients who were discharged to home from patients who were not discharged to home. We assessed discrimination with receiver operating curves (ROC) and c-statistics. A c-statistic of 1.0 indicates perfect discrimination, while a c-statistic of 0.5 indicates discrimination similar to chance [23].
Calibration determines whether the predicted probabilities of the algorithm are similar to the actual observed events. The calibration intercept determines whether the algorithm is over- or underestimating the probabilities; the calibration slope determines whether the predictor effects are similar in the training and the testing set. A perfect model has an intercept score of 0.0 and a slope score of 1.0.
Overall model performance was assessed with the Brier score, calculated by obtaining the mean squared error between the observed events in the testing set and the predictions given by the algorithm. A perfect algorithm would have a score of 0. The Brier score combines discrimination and calibration characteristics, but must always be interpreted in the context of the prevalence of the predicted outcome—in our study non-home discharge [22]. If the prevalence of the outcome variable is lower, the maximum score of a poor algorithm is lower as well. Therefore, the Brier score must be compared with the null Brier score, which is calculated by assigning each patient a probability equivalent to the prevalence of non-home discharge. Steyerberg et al. [22] offers a detailed framework of all performance metrics.
The algorithm with the best performance based on discrimination, calibration, and overall performance was subsequently incorporated in a Web-based application. This application is built to input the variable values collected by a healthcare provider into the algorithm, calculate the probability, and output the result to the healthcare provider in real-time.
Microsoft Azure, STATA 13 (StataCorp LP, College Station, TX, USA), RStudio version 1.0.153, and Python version 3.6 (Python Software Foundation) (Anaconda distribution) were used for data analysis, model creation, and application development.
Of the 28,600 patients, 18.2% were not discharged to home. Baseline characteristics are given in Table 1. The following variables were included after variable selection: age (years), sex (male/female), body mass index (BMI), American Society of Anesthesiologists (ASA) class (I/II/III/IV), functional status (independent/dependent), number of levels included in surgery (1 or 2 levels/3 or more levels), fusion (yes/no), diabetes (no/oral medication/insulin dependent), preoperative hematocrit (vol.%), and preoperative serum creatinine (mg/dL).Table 1
Baseline characteristics of patients, n = 28,600
| Variable | Definition |
|---|---|
| Age | |
| Median (IQR) | 67 (58–74) |
| Missing, n (%) | 113 (0.37) |
| Sex | |
| Female | 13,518 (47.3) |
| Male | 15,082 (52.7) |
| BMI | |
| Median (IQR) | 30.09 (26.58–34.43) |
| Missing, n (%) | 125 (0.34) |
| Functional status | |
| Independent | 27,917 (97.6) |
| Dependent | 508 (1.8) |
| Missing, n (%) | 175 (0.6) |
| Fusion | |
| No | 13,053 (45.6) |
| Yes | 15,547 (54.4) |
| Approach | |
| Posterior | 26,633 (93.1) |
| Anterior | 682 (2.4) |
| Combined | 1285 (4.5) |
| Level | |
| One or two levels | 14,618 (41.5) |
| Three or more levels | 20,638 (58.5) |
| Instrumentation | |
| No | 15,973 (55.8) |
| Yes | 12,627 (44.2) |
| ASA class | |
| I | 475 (1.7) |
| II | 12,281 (42.9) |
| III | 15,079 (52.7) |
| IV | 765 (2.7) |
| Hematocrit | |
| Median (IQR) | 41.1 (38.4–43.8) |
| Missing, n (%) | 1926 (6.7) |
| White blood cell | |
| Median (IQR) | 7.0 (5.8–8.4) |
| Missing, n (%) | 2260 (7.9) |
| Platelet | |
| Median (IQR) | 232 (194–276) |
| Missing, n (%) | 2285 (7.9) |
| Sodium | |
| Median (IQR) | 140 (138–141) |
| Missing, n (%) | 3401 (11.9) |
| Creatinine | |
| Median (IQR) | 0.90 (0.77–1.09) |
| Missing, n (%) | 3270 (11.4) |
| Diabetes | |
| No | 22,488 (78.6) |
| Oral medication | 4111 (14.4) |
| Insulin dependent | 2001 (7.0) |
| Hypertension | 18,742 (65.5) |
| Current smoker | 4676 (16.3) |
| Chronic obstructive pulmonary disease | 1493 (5.2) |
| Chronic steroid use | 1189 (4.2) |
| Bleeding disorder | 571 (2.0) |
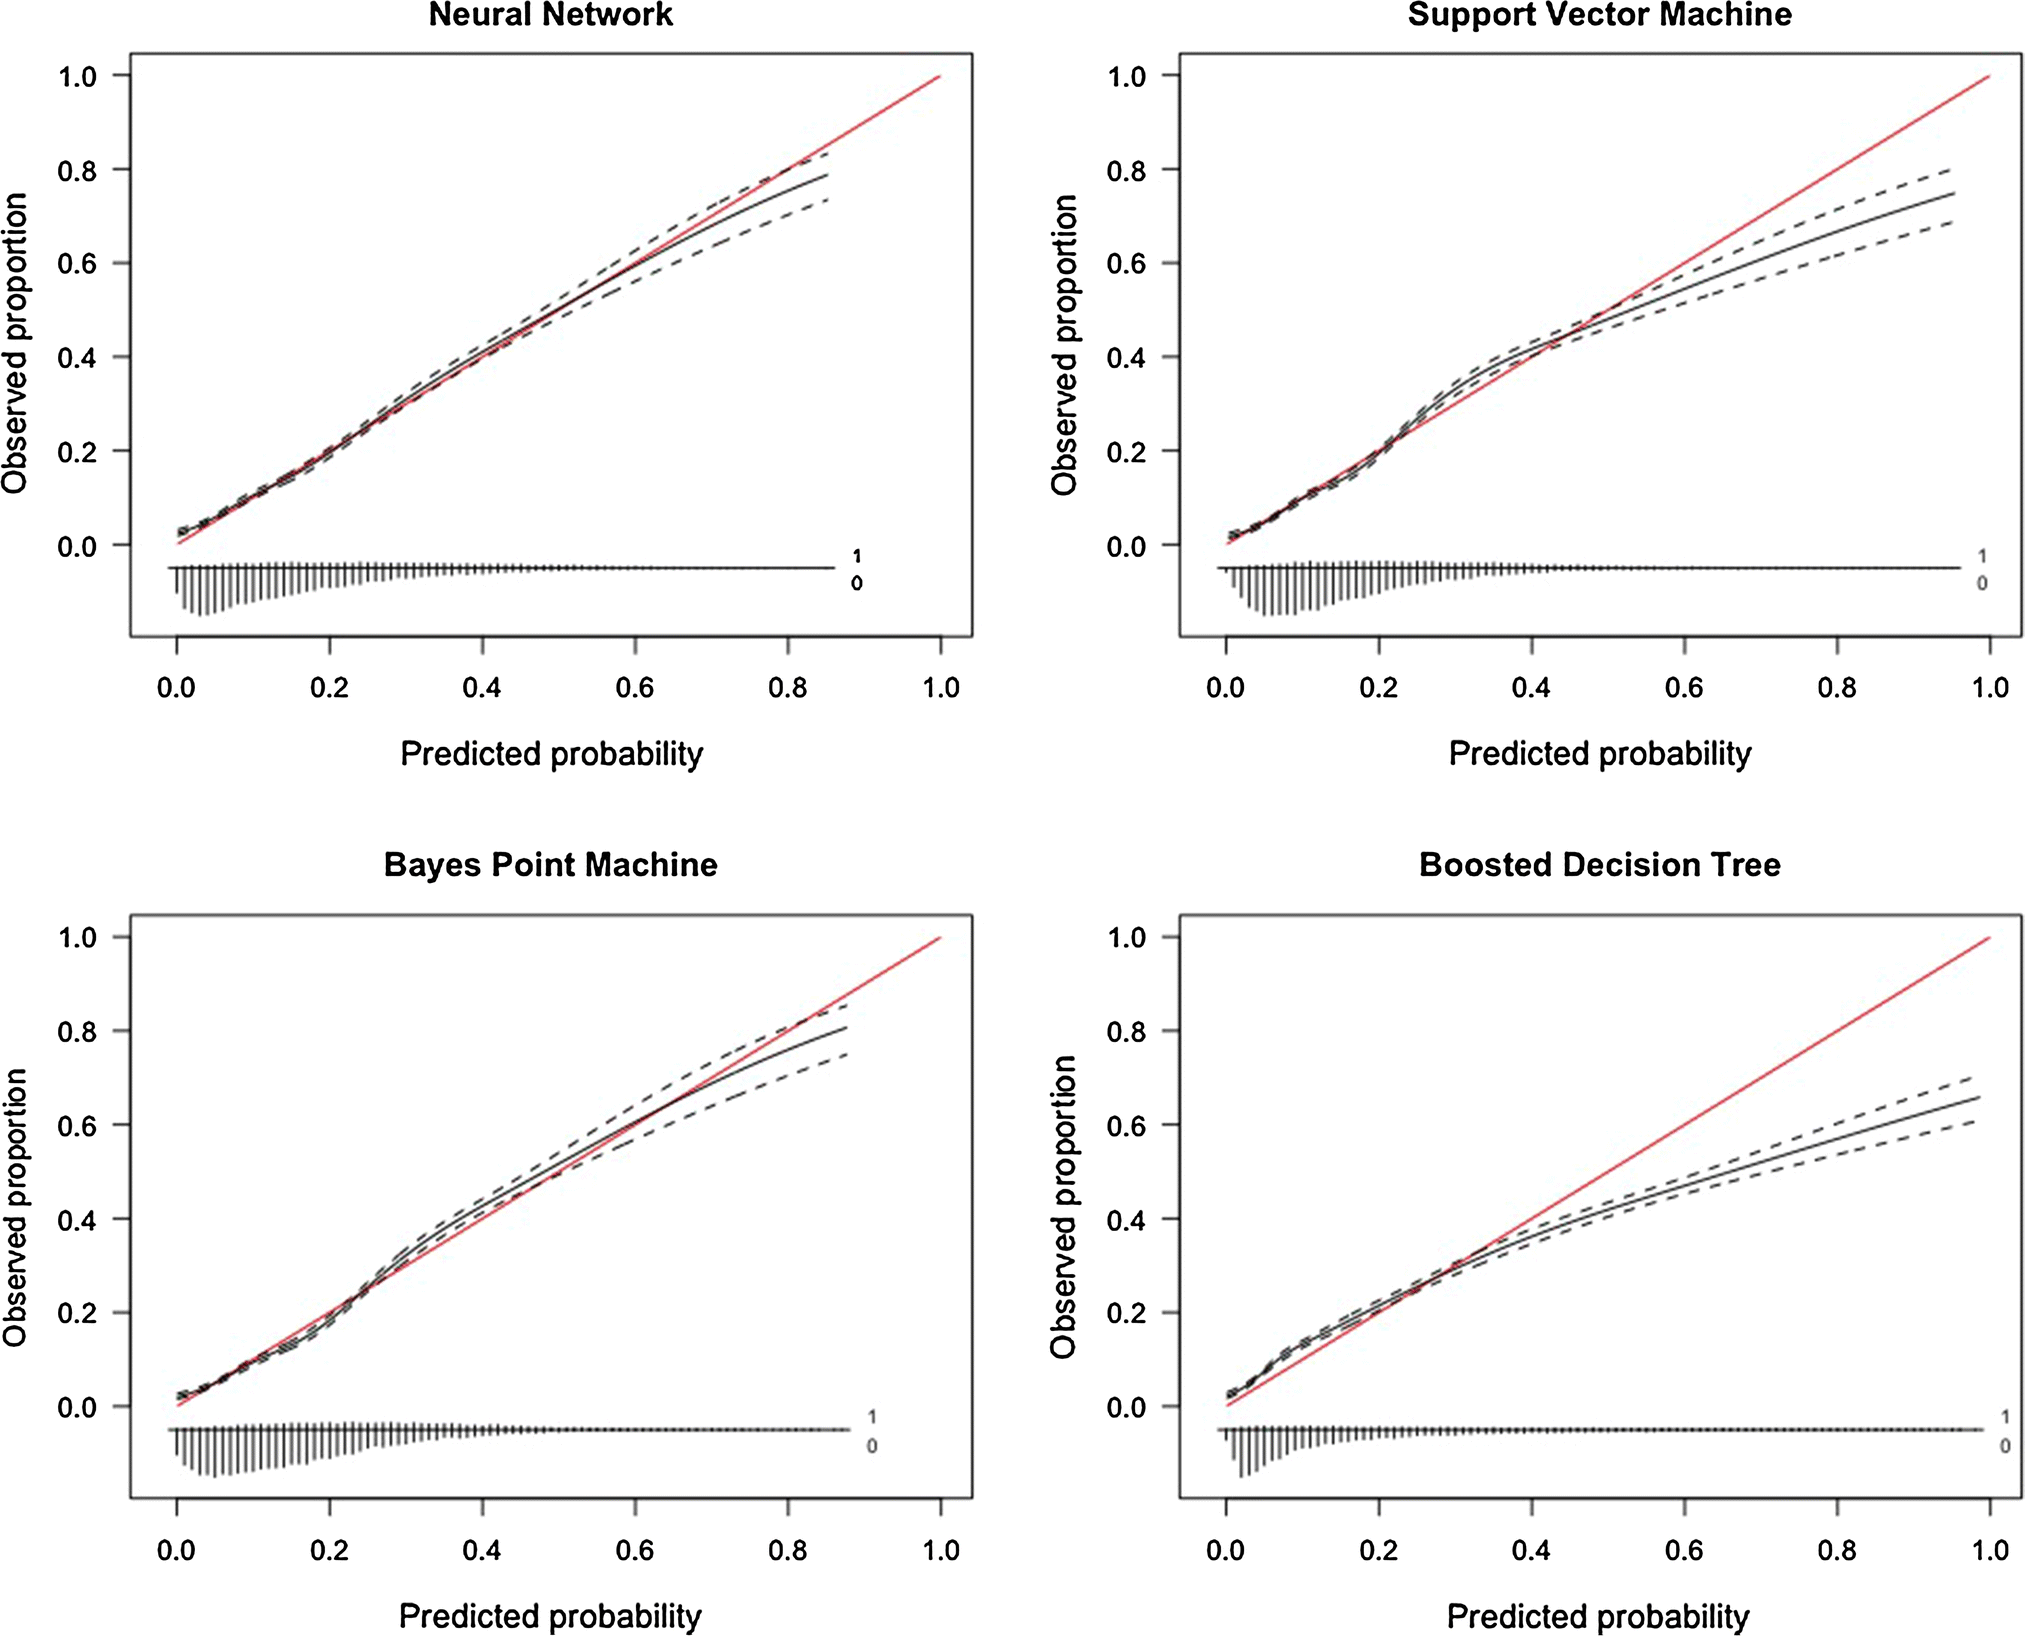
BMI body mass index, ASA American Society of Anesthesiologists Classification; IQRinterquartile rangeTable 2 shows the list of the AUC, calibration slope and intercept, and Brier score for the four algorithms. The null Brier score was 0.150. Based on numerical and graphical assessment of these metrics, the neural network algorithm was chosen as the final model with a c-statistic of 0.751, a calibration slope of 0.933, a calibration intercept of 0.037, and a Brier score of 0.130 (Fig. 1).Table 2
Model performance for discharge disposition prediction on training set
| Performance metric | Neural network | Support vector machine | Bayes point machine | Boosted decision tree |
|---|---|---|---|---|
| C-statistic | 0.751 | 0.743 | 0.752 | 0.747 |
| Calibration slope | 0.933 | 0.996 | 1.038 | 0.694 |
| Calibration intercept | 0.037 | 5.2 × 10⁻⁴ | − 3.57 × 10⁻⁴ | 4.58 × 10⁻³ |
| Brier score | 0.130 | 0.131 | 0.131 | 0.133 |
| Null model Brier score | 0.150 |
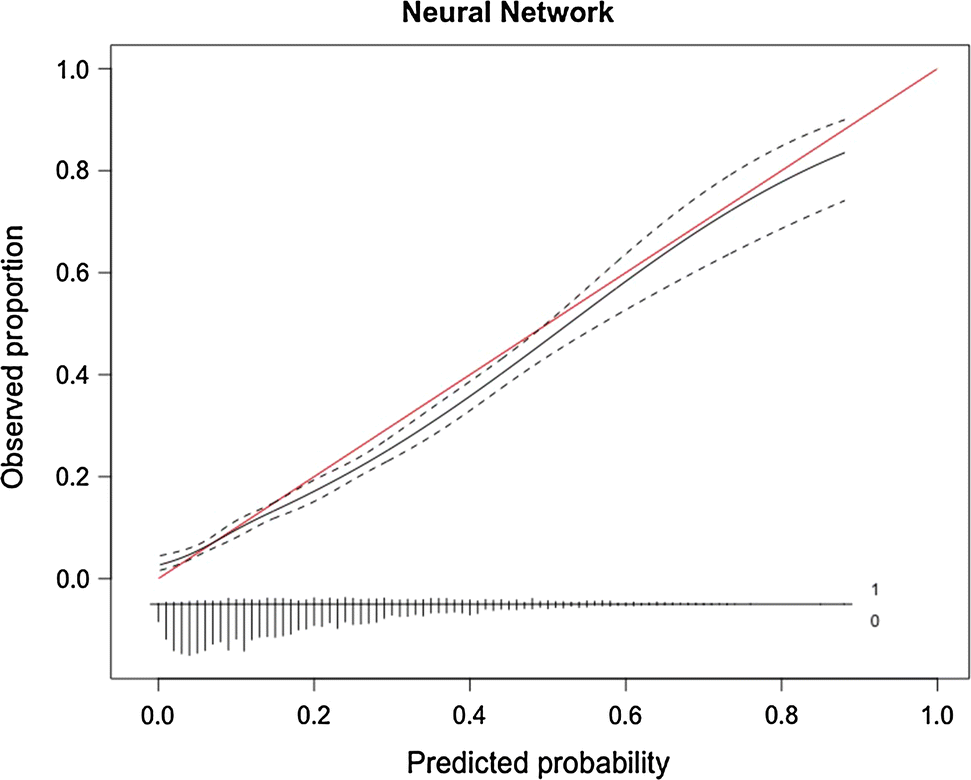
When evaluating the neural network algorithm on the testing set a c-statistic of 0.744, a calibration slope of 0.915, a calibration intercept of − 0.131, and a Brier score of 0.131 were achieved (Figs. 2, 3).
The Web application based on the neural network can be accessed at https://sorg-apps.shinyapps.io/stenosisdisposition/. As an example, a 75-year-old male is scheduled for two-level surgery with fusion. He has a BMI of 34 and is classified as ASA II; he lives independently at home and does not have diabetes. His preoperative creatinine level is 2.9 mg/dL and preoperative hematocrit level is 34%. After filling out these values in the algorithm, this patient has a 24.4% chance of non-home discharge.
We aimed to develop an ML algorithm that can predict discharge to a RF/SNF after elective surgery for lumbar stenosis. Our algorithm included age, sex, BMI, functional status, ASA class, level, fusion, diabetes, preoperative hematocrit, and preoperative serum creatinine. The neural network was picked as the best algorithm based on discrimination (c-statistic = 0.752), calibration (intercept = − 1.27 × 10⁻⁵; slope = 0.996), and overall performance (Brier score = 0.1257) in the training set and subsequent performance on internal validation.
Our study has several limitations. First, studies using a large clinical database are always affected by miscoding and other inaccuracies. Although widely used, few studies have assessed the actual accuracy of the NSQIP database. Rolston et al. [24] found many internal inconsistencies between procedure CPT codes and postoperative ICD-9 codes in neurosurgery. However, the codes for lumbar stenosis and lumbar surgery are more straightforward so we estimate that potential miscoding will not severely affect our algorithm. Second, certain variables of interest are not always available in the ACS-NSQIP. Considering preoperative patient-reported outcomes are known to be predictors of discharge placement after spine surgery, we consider this a major limitation of our work [25]. While the current AUC of 0.751 is fair, the algorithm could potentially be improved by adding these and other relevant variables. Third, although the ACS-NSQIP database consists of data of 680 US hospitals, these results may not be applicable to all the patients it is intended for due to differences in demographic or clinical characteristics. Fourth, the differences between the algorithms are small, which makes the choice for a neural network somewhat arbitrary. However, settling on an algorithm based on numerical and graphical assessment is the most reproducible method. Finally, it must be emphasized that this study focuses on accurate prediction of a, rather simple, prespecified outcome (here ‘non-home discharge’) in contrast to the explanation of this outcome, which is the focus of the vast majority of medical research. The variables in our model cannot simply be interpreted as independent explanatory variables.
Age, sex, diabetes, functional status, fusion, and preoperative hematocrit have previously been identified in other (explanatory) studies on discharge placement after spine surgery [26, 27, 28]. The inclusion of most variables in our model can likely be attributed to being independent risk factors for major complications after surgery for lumbar stenosis. Age, diabetes, BMI, functional status, ASA class, preoperative hematocrit, and preoperative creatinine have all been shown to be associated with major complications [29, 30, 31, 32]. Number of levels and fusion are likely surrogates for longer procedural time which is also implicated in postoperative morbidity [30, 31].
The importance of eliminating delayed discharges for patients lies in averting the risks associated with longer hospitalization and the advantages of starting rehabilitation earlier. Umarji et al. [11] found that 58% of patients with a hip fracture acquire nosocomial infections when discharge was delayed beyond 8 days. Hauck et al. [33] found that each additional night in hospital increases the risk by 0.5% for adverse drug events and 1.6% for infections. With regard to rehabilitation, other studies have found worse post-rehabilitation scores for patients with delays in discharge [34, 35]. While those studies did not necessarily focus on elective spine patients, other spine centers have acknowledged the problem and aimed to construct risk scores for predicting discharge placement. McGirt et al. [15] created the Carolina-Semmes grading score for all degenerative lumbar spine surgery based on logistic regression. They included the variables age, ASA class, fusion, Oswestry disability index score, ambulation, and non-private insurance and achieved an area under the curve (AUC) of 0.731. Kanaan et al. [14] used age, prior level of function, and gait distance to create a model for discharge placement after lumbar laminectomy and achieved an AUC of 0.80. Slover et al. [13] stratified spine patients in low, medium, and high risk based on points for age, sex, walking distance, gait aid, community support, and availability of caregiver at home. They did not report an AUC. None of the above-mentioned studies assessed calibration.
Although often overlooked, assessment of calibration is an essential feature of studies creating prediction models. In our study, the neural network and the Bayes point machine had highly similar performance metrics. However, on graphical assessment the calibration of the Bayes point machine was slightly inaccurate between the predicted probabilities of 0.15 and 0.50, which represent a significant part of the study population (Fig. 3). This deviation means the algorithm slightly underestimates the chance of discharge to a RF/SNF, which for some patients would mean no placement has been arranged before surgery—the situation as it is right now. Assessing calibration over the full range of predictions is crucial in ensuring the model is useful [23]. Future studies aiming to create models should always feature a numerical and graphical assessment of calibration. As depicted in the calibration subplot in Fig. 3, the vast majority of patients have a 10–40% chance of discharge to an RF/SNF, as can be expected for an elective spine procedure. The algorithm is meant to trace and designate higher-risk patients so their potential discharge delay might be avoided.
Where hospitals set their threshold to arrange an RF/SNF placement in advance would differ per health system. There are major differences in the availability of RF/SNF beds, insurance regulations, and discharge practices between countries [36, 37, 38]. Length of stay for deforming dorsopathies ranges from 4.6 to 27 within Europe. American patients are three times more likely to be discharged to RF/SNF than Canadian patients with a hip fracture [39]. While these complex differences do exist, delayed discharges are a problem for patients and hospitals around the world [9]. Mirroring the differences between countries, a wide variety of policies have been implemented internationally to try to lower amount and duration of these delayed discharges [40, 41]. In Great Britain, imposing fines has reduced the number of delayed discharges, but simultaneously rising readmission rates brought up questions about the quality of discharges [42]. Sweden tried making local municipalities financially responsible for the care of elderly [43]. Others focused on developing allocation decision tools or the effect of increasing nursing home supply [12, 44].
At the very core of all these suggested policies, regardless of health system, is the inability to make an accurate assessment of who will need a RF/SNF placement with enough time to set things in motion. An ML algorithm can give an individualized prediction. Thorough external validation needs to be performed along with an assessment of where to place the threshold before these algorithms can be implemented, especially if the algorithm were to be used outside the USA.
Nevertheless, considering the risks for patients and the unnecessary costs involved with longer hospitalization due to delayed discharges, the use of predictive algorithms could be worth the initial effort.
A prediction tool based on an ML algorithm is able to predict discharge placement after surgery for lumbar spinal stenosis with both good discrimination and calibration. This methodology can be implemented for a variety of other diseases and elective treatments, which could avoid risks associated with delayed discharge and lower costs.
The American College of Surgeons National Surgical Quality Improvement Program and the hospitals participating in the ACS-NSQIP are the source of the data used herein; they have not verified and are not responsible for the statistical validity of the data analysis or the conclusions derived by the authors.
The authors have nothing to disclose.
Springer Nature remains neutral with regard to jurisdictional claims in published maps and institutional affiliations.
586_2019_5928_MOESM1_ESM.pptx (3.3 mb)Supplementary material 1 (PPTX 3336 kb)
See Table 3.Table 3
Advantages and disadvantages of algorithms
| Advantage | Disadvantage | |
|---|---|---|
| Neural network | Good discriminative abilities | Hard to interpret |
| Support vector machine | Work well on linear relationships | Hard to interpret; as linear classifier assumes logistic distribution of data |
| Bayes point machine | Not prone to be overfitted | As linear classifier assumes logistic distribution of data |
| Boosted decision tree | Good discriminative abilities; relationships can be observed | Memory-intensive |
© The Author(s) 2019
Open AccessThis article is distributed under the terms of the Creative Commons Attribution 4.0 International License (http://creativecommons.org/licenses/by/4.0/), which permits unrestricted use, distribution, and reproduction in any medium, provided you give appropriate credit to the original author(s) and the source, provide a link to the Creative Commons license, and indicate if changes were made.
CrossMarkCite this article as:Ogink, P.T., Karhade, A.V., Thio, Q.C.B.S. et al. Eur Spine J (2019) 28: 1433. https://doi.org/10.1007/s00586-019-05928-z