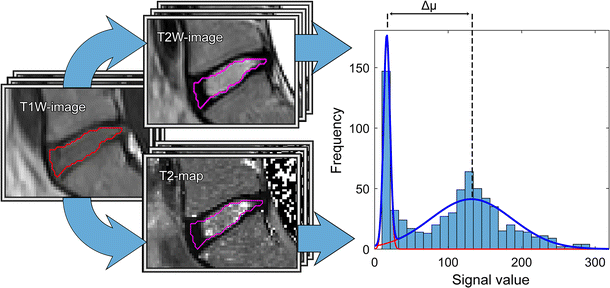
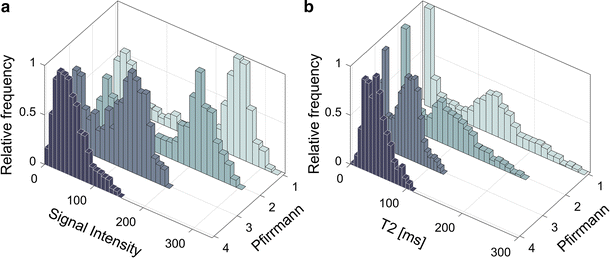
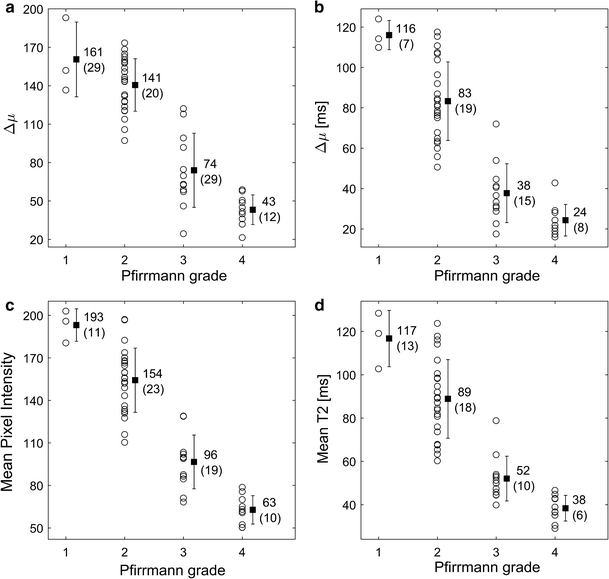
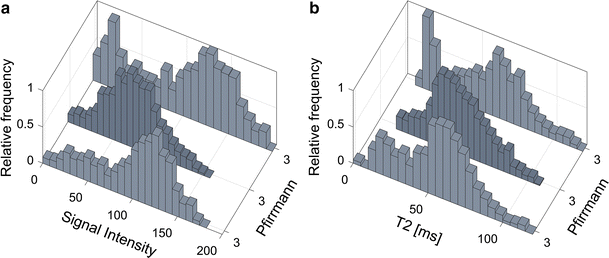
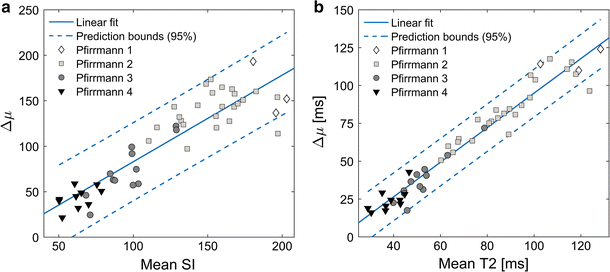
In the pursuit of finding a tool for objective and continuous classification of IVD degeneration, this study investigated IVD grey scale distributions, i.e., histograms. It was shown that the decoding of the IVD heterogeneity with histogram analysis is feasible not only for T2-mapping, but also for conventional T2W-imaging. This is advantageous as conventional T2W MR images, compared to T2-maps, are frequently used in a clinical setting. Moreover, they offer reduced acquisition time while still maintaining the ability to convert qualitative data into quantitative data. It should be noted that T2W-imaging is sensitive to the choice of parameters for signal amplification. Consequently, only when all T2W-images are acquired using the same amplification settings in the MRI, as done in this study, the pixel values across all T2W-images can be compared.
Despite the fact that patients suffering from LBP to some extent have degenerative IVDs, conventional IVD degeneration measurements (Pfirrmann grading) alone cannot identify patients with lumbar pain. In contrast to Pfirrmann grading, which is a coarse and to some extent subjective marker of degeneration as it is based on visual interpretation [9], histogram analysis have the potential to objectively depict differences in the IVDs, not only between different grades, but also within single grades. Histogram analysis may thus produce sensitive IVD histogram features, which can be used for detection of early IVD degeneration, as well as a potential tool to evaluate early therapy response. In addition, IVD degeneration has been shown to correlate to Oswestry Disability Index [18], possibly enabling histogram features to indicate patient disability.
All investigated histogram features presented in this study correlated well with Pfirrmann grade. Compared to other studies, similar T2-values of the IVDs were retrieved [14, 16, 19]. Histogram analysis of IVDs of different Pfirrmann grades generated a wide and continuous range of Δµwhich shows that histogram analysis might be a suitable tool to be used for objective and continuous IVD degeneration classification. Histograms of non-degenerated IVDs based on T2W-images or T2-maps data should display two well separated peaks, one from AF and one from NP. In the process of IVD degeneration, an increased number of AF fissures are developed that may result in leakage of NP into the AF [20, 21]. Hypothetically, such leakage could be characterized by a region of high signal intensity in the otherwise low signal AF. One example of such high signal intensity in the IVD are High Intensity Zones (HIZ) which represents annular fissures [22]. Hypothetically, due to the common sub-voxel size of annulus fissures, only a minority of these fissures are fully visualized in MR images. Therefore, a detailed analysis and clear visualization of HIZ may be hampered by limited spatial resolution often restricted by the MRI slice thickness width. This might be a reason to the inconclusive research where some studies show HIZ being closely related to pain [23, 24], and other studies do not [25, 26]. Nonetheless, the “invisible” fissures and loss of water and collagen concentration in the NP may be identified by histogram analysis as an increase of intermediate histogram values and a decrease in Gaussian peak separation, Δµ, reflecting the tissue mixture in the voxel volume.
Histogram analysis revealed that histograms of some IVD grey scale distributions within the same Pfirrmann group exhibit vastly different histogram topology. One hypothesis to this phenomenon is that some IVDs may have a wide dorsal annular rift, visible as a clear HIZ, while other IVDs may have multiple smaller fissures generating more intermediate voxel values. Hence, histogram analysis may possibly generate objective features that are able to indicate differences in IVDs that macroscopically seem comparable, but at disc level differs between symptomatic and asymptomatic IVDs. Although fissures and HIZ have been associated with an ingrowth of nerve endings and granulation tissue, which is a prerequisite to cause pain [15], it is today not established how the distribution of fissures are related to LBP. With the use of quantitative IVD histogram features, extended investigations of the development of fissures within both clinical settings as well as in research can be performed.
This study would have benefitted from including more individuals with IVDs of Pfirrmann grade 1 and 5, to statistically determine correlation between histogram features and IVD degeneration in terms of Pfirrmann grade. However, as IVDs of Pfirrmann grade 1 are non-degenerated and IVDs of Pfirrmann grade 5 are extensively degenerated and almost fused, these groups are of less interest regarding interventional measures. Another limitation of this study is that the IVD evaluation covered only a mid-sagittal IVD width of about one centimetre. An evaluation covering a larger IVD volume, without increasing the image slice thickness, could potentially more accurately describe the regional heterogeneity also in lateral regions. It is known that the spine is a dynamic structure which is influenced by axial load or recumbency [27, 28]. As all imaging was done with the patients in a supine position without axial load, the IVD morphological state might have deviated from upright standing conditions. Future studies are warranted to examine the loading effect.
Quantification of unique regional patterns in MR images, such as histogram patterns, is emerging for phenotyping of different tissues. By integrating histogram analysis with automatic techniques for image analysis, e.g. machine learning [29], image data can be effectively extracted in a more clinically feasible way.
Development of a fully automatic segmentation algorithm should be considered as it could reduce variations in the location and size of the ROI and ultimately reduce the spread of calculated data. As only patients with chronic LBP were studied, it is currently unknown if IVD histogram analysis between an asymptomatic and symptomatic group would differ. Studies in which IVD histogram features of asymptomatic and symptomatic individuals are compared are warranted. Such studies might indicate whether histogram features can improve patient management and indicate LBP.


