Splendiani, A., Bruno, F., Marsecano, C. et al. Eur Spine J (2019) 28: 983. https://doi.org/10.1007/s00586-019-05974-7
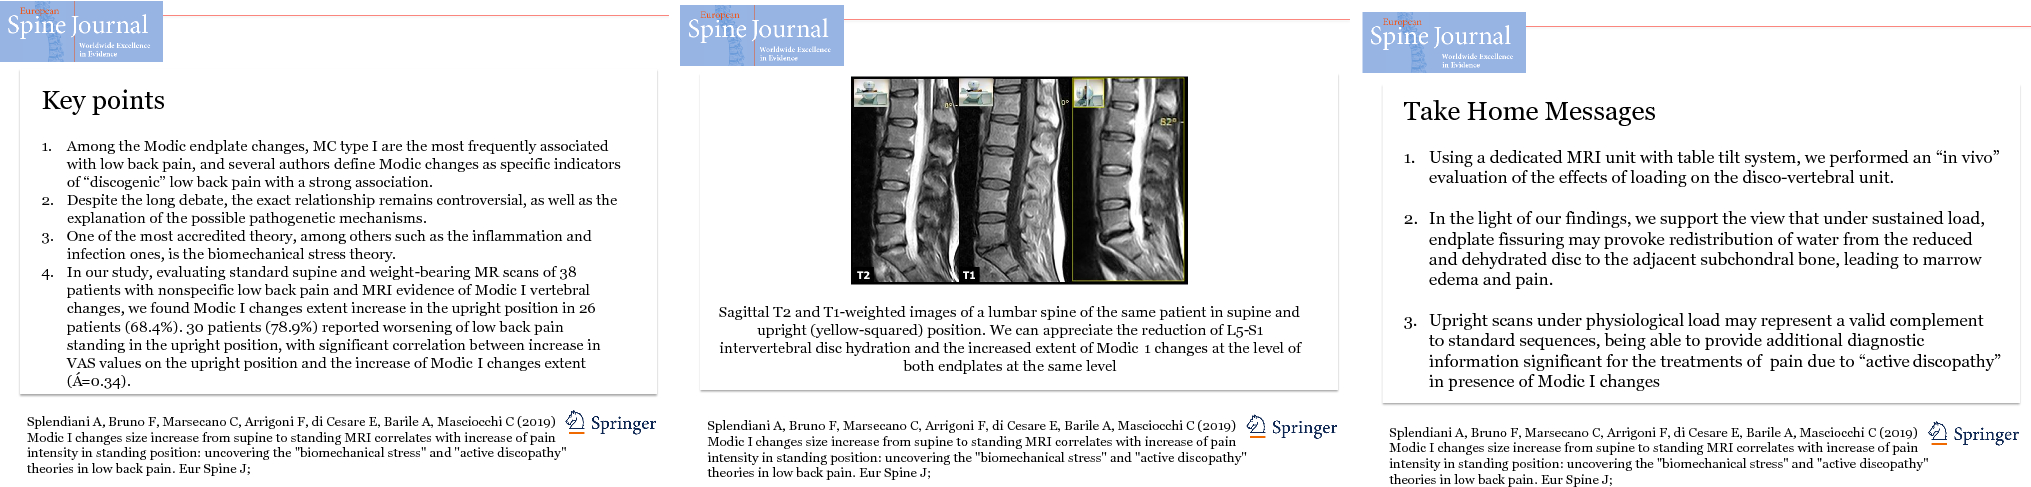
To evaluate the relationship between degenerative disc, endplate Modic changes (MC) type I, and pain during upright weight-bearing MRI scan of the lumbar spine in a cohort of patients with non-specific low back pain.
We evaluated 38 patients with non-specific low back pain and MRI evidence of Modic I vertebral changes. The patients were evaluated in a standard and upright weight-bearing position using a dedicated MR unit. The extent of endplate MC type I, intervertebral disc height at the involved level, and degree of degeneration in the same intervertebral disc were compared. Pain was assessed through the VAS questionnaire.
In the upright position, the area of Modic I changes increased in 26 patients (68.4%, p ≤ 0.001) compared to the supine position. In the upright position, reduction in the disc height was found in 35 patients (92.1%). Correlation analysis showed moderate negative correlation (ρ = − 0.45) between intervertebral disc height and increase in the area of Modic I changes, and weak positive correlation (ρ = 0.12) between Pfirrmann grade and increase in the area of Modic I changes. At clinical evaluation, 30 patients (78.9%) reported worsening of low back pain standing in the upright position. Increase in VAS values on the upright position correlated significantly (ρ = 0.34) with an increase in the area of Modic I changes.
Our results showed the modifications of Modic I changes under loading, with MRI evidence of increased MC area extent in the upright position and correlation between Modic changes extension increase and increase in pain in the standing position. Weight-bearing MRI scans represent a valuable complement to standard sequences since they provide the radiologist with additional diagnostic information about low back pain.
These slides can be retrieved from Electronic Supplementary Material.
Modic changes Weight-bearing MRI Low back pain
The online version of this article ( https://doi.org/10.1007/s00586-019-05974-7) contains supplementary material, which is available to authorized users.
Degenerative disc disease of the spine causing low back pain is a leading cause of morbidity and chronic disability [1].
MRI is the preferred imaging technique to evaluate the degenerative changes of the spine [2, 3], showing high sensitivity and specificity in the diagnosis of conditions like disc herniation, spinal stenosis, and spondylodiscitis [4, 5, 6, 7]. In the last years, MRI signal changes in vertebral endplates, especially Modic changes (MC) type I, have been advocated to be a potential specific cause of low back pain [8, 9]. Type I Modic signal changes are characterized by signal hypointensity on T1-weighted sequences and signal hyperintensity on T2-weighted sequences, corresponding to bone marrow oedema pattern. The exact pathophysiology of MC is still unclear, and the relationship between disc degeneration, endplates, and bone marrow has not been quantified, yet [7, 10, 11]. The role of biomechanical stress has been often advocated to explain the pathophysiology of Modic I changes.
Upright MRI can unmask conditions missed on standard supine examinations, especially in those patients in whom symptomatology is exacerbated in orthostatic position. In these patients, the standard supine examinations may produce false negative results. Several approaches have been tried during the last years to evaluate the spine under physiological load, the most diffuse being the axial load techniques, and, most recently, the use of open MRI units (low-field 0.25T G-scan; ESAOTE) [12, 13]. These scanners allow imaging of the spine under physiological load conditions with the patient positioned in the upright position, thanks to a table tilt system [14].
The present study aimed to evaluate the relationship between degenerative disc, endplate MC type I, and pain level during upright weight-bearing MRI scan of the lumbar spine in a cohort of patients with non-specific low back pain. The underlying hypothesis was that loading could play a role in the presentation of Modic I changes and symptoms of low back pain.
Thirty-eight patients (20 females and 18 males, mean age 47.4 ± 5.2 years, range 27–69) were submitted to MRI evaluation of the lumbar spine due to non-specific low back pain. The examinations showed MRI evidence of Modic I vertebral changes, defined as endplate areas of hypointensity on T1-weighted and hyperintensity on T2-weighted images.
Exclusion criteria were a history of rheumatic diseases, spinal trauma, spinal malformations, infectious–inflammatory diseases of the spine, spinal cord injury, and primary and secondary spine tumours. Patients with MRI evidence of posterior disc extrusion, signs of nerve root compression, or facet joint pathology were also excluded.
Pain on both supine and upright positions was assessed using VAS questionnaire administered to all patients during anamnesis before and after the examination. Informed consent was obtained from all participants.
MRI examinations were performed using an open 0.25T MR G-scan unit (ESAOTE, Genua, Italy) that allows the acquisition of lumbosacral spine images on both supine and upright positions, with the table rotated to approximately 82°. This degree of inclination simulates gravitational load, without feelings of instability, and avoids repositioning. Depending on the patients’ size, different surface coils dedicated for the lumbar spine were employed to acquire images. All scans were performed in the setting of the same MR examination, in the supine position first and subsequently, after table tilt, under physiological load, using the same sequences that included: sagittal FSE T2-weighted sequences (TR/TE 2860/90 ms; 4 mm), sagittal SE T1-weighted (TR/TE 560/26 ms; 4 mm), and axial 3D HYCE (hybrid contrast enhanced, a type of gradient echo balanced sequence) (TR/TE 4420/130 ms; 3.4 mm). The following parameters were used for the sagittal sequences: 224 × 208 matrix, 320 × 320 mm FOV, and 4 mm slice thickness with 0.5-mm slice interval. For the axial 3D HYCE sequence, the parameters were as follows: 224 × 192 matrix, 300 × 300 mm FOV, and 4 mm slice thickness with 0.5-mm slice interval. The acquisition time was about 20 min for each position plus 5 min for patient’s preparation/positioning. All MR examinations were performed during the morning; this allowed to minimize bias due to physiological diurnal variation in intervertebral disc volume and morphology. All images were sent via the local network to the RIS/PACS (Polaris, Kodak Carestream PACS) of our institute for post-acquisition analysis.
The images from all patients in supine and standing position were reviewed independently by two neuroradiologists, with 25- and 6-year experience, respectively. Both the observers were blinded to history, clinical objectivity, and matching of the patients.
The evaluation included all 11 endplates in the lumbosacral spine (L1 through S1) using T1- and T2-weighted midsagittal images.
The MRI features taken into account were (1) extent of the endplate MC type I; (2) intervertebral disc height at the level involved by the endplate Modic lesions; (3) degree of degeneration of the same intervertebral disc, expressed in a 5-point scale (Pfirrmann grades I–V). All parameters were analysed on both supine and upright positions.The extent of Modic I changes was evaluated as the mean area of 3 consecutive slices measured with a freehand ROI at the level of the maximum cranio-caudal extension in each vertebral body and was expressed in square millimetres (mm2) (Fig. 1). In case of involvement of both endplates, areas were summed. Since the standard deviation between the two sets of measurements was not significant, we used the mean of the data (see Table 1).
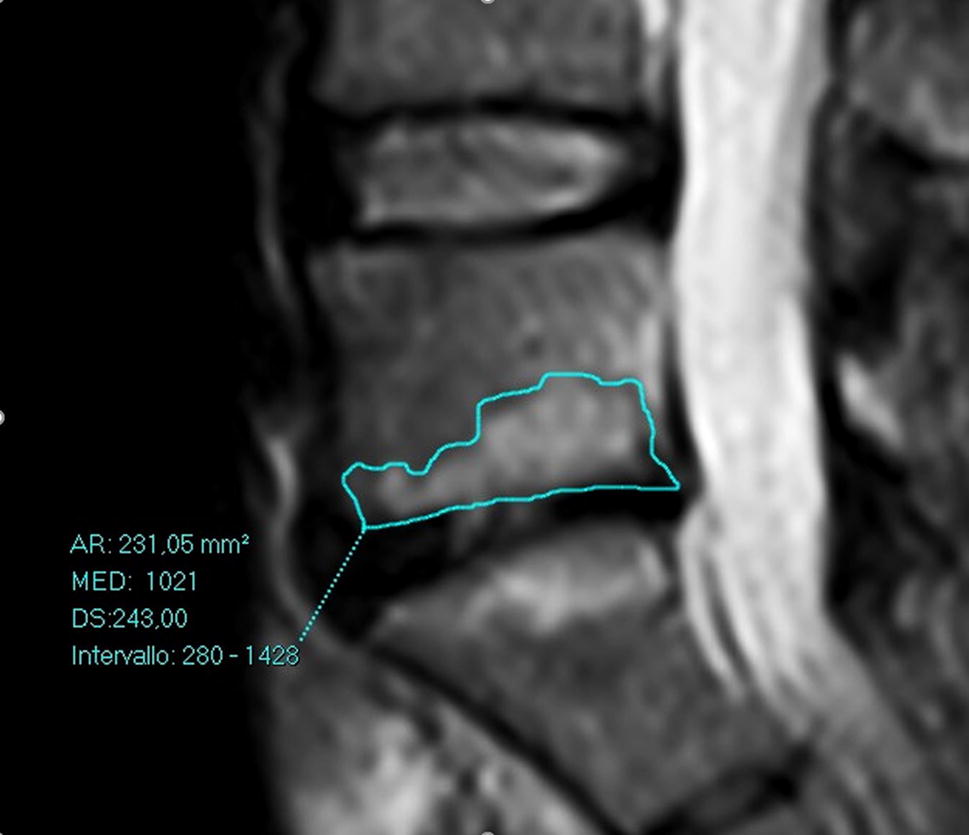
Table 1
Detailed findings of MCs, disc height and degeneration, and pain in our series
| PAT | MODIC SUP | PFIR SUP | DISC H SUP | MODIC UP | PFIR UP | DISC H UP | VAS SUP | VAS UP |
|---|---|---|---|---|---|---|---|---|
| 1 | 231.87 | IV | 5.8 | 270.74 | V | 4 | 5 | 8 |
| 2 | 184.02 | II | 11.3 | 232.17 | III | 8.4 | 4 | 7 |
| 3 | 165.31 | II | 9.3 | 209.58 | III | 6.6 | 6 | 8 |
| 4 | 142.54 | III | 9.2 | 143.10 | III | 9.2 | 6 | 6 |
| 5 | 174.11 | IV | 6.8 | 209.76 | V | 4 | 7 | 9 |
| 6 | 230.92 | II | 6.6 | 231.05 | II | 5.8 | 7 | 7 |
| 7 | 147.00 | II | 9.2 | 239.61 | III | 6.2 | 3 | 7 |
| 8 | 178.50 | II | 8.9 | 179.10 | II | 7.8 | 5 | 5 |
| 9 | 109.97 | IV | 5.6 | 110.55 | IV | 4.9 | 4 | 8 |
| 10 | 90.33 | I | 8.1 | 122.54 | II | 6.5 | 6 | 9 |
| 11 | 161.48 | I | 9.8 | 197.32 | I | 7.1 | 5 | 9 |
| 12 | 172.37 | IV | 5.2 | 173.25 | IV | 4.6 | 7 | 8 |
| 13 | 169.27 | III | 5.8 | 170.01 | III | 5.2 | 8 | 8 |
| 14 | 126.05 | IV | 2.9 | 126.98 | IV | 1.9 | 7 | 7 |
| 15 | 125.28 | II | 7.5 | 186.32 | III | 6.1 | 7 | 9 |
| 16 | 116.06 | II | 8.8 | 116.56 | II | 8.4 | 3 | 5 |
| 17 | 213.13 | III | 8.1 | 266.82 | IV | 6 | 4 | 8 |
| 18 | 108.07 | III | 6.4 | 110.45 | III | 4,3 | 5 | 7 |
| 19 | 96.74 | II | 11.4 | 97.13 | II | 10.1 | 6 | 6 |
| 20 | 221.87 | II | 7.9 | 260.57 | II | 8.5 | 3 | 8 |
| 21 | 173.02 | II | 9.9 | 228.06 | II | 8.4 | 4 | 8 |
| 22 | 174.43 | III | 6.8 | 212.00 | V | 5.1 | 4 | 8 |
| 23 | 135.74 | II | 7.2 | 162.89 | III | 6.3 | 3 | 8 |
| 24 | 163.45 | IV | 6.1 | 209.67 | III | 6.1 | 4 | 7 |
| 25 | 231.29 | III | 5.7 | 232.00 | IV | 4.5 | 5 | 6 |
| 26 | 149.23 | II | 8.5 | 231.79 | III | 7.2 | 5 | 9 |
| 27 | 177.50 | I | 10.2 | 178.10 | I | 8.6 | 5 | 7 |
| 28 | 109.92 | III | 5.6 | 110.00 | III | 4.2 | 6 | 8 |
| 29 | 91.39 | IV | 5.2 | 125.42 | V | 4.7 | 6 | 9 |
| 30 | 152.48 | II | 8.5 | 186.23 | III | 6.9 | 5 | 9 |
| 31 | 184.12 | II | 7.1 | 178.50 | II | 6.3 | 6 | 9 |
| 32 | 156.01 | II | 8 | 159.22 | II | 7.2 | 5 | 8 |
| 33 | 112.89 | I | 9.1 | 113.31 | I | 8.7 | 8 | 9 |
| 34 | 134.37 | IV | 6.4 | 192.45 | V | 5.1 | 7 | 7 |
| 35 | 118.1 | III | 7.5 | 117.88 | III | 6.8 | 6 | 9 |
| 36 | 209.66 | IV | 5.4 | 265.93 | V | 4.2 | 8 | 8 |
| 37 | 107.65 | I | 10.3 | 108.12 | I | 9.1 | 5 | 9 |
| 38 | 95.3 | IV | 6.5 | 96.11 | IV | 5.9 | 3 | 8 |
The intervertebral disc height was measured as the mean height of the intervertebral disc (anterior, middle, and posterior portion) evaluated on three contiguous midsagittal T2-weighted slices and was expressed in millimetres (mm).
The degree of intervertebral disc degeneration was evaluated using the Pfirrmann classification, which proposes five grades (I–V).
The intra- and interobserver reliability of the analysis of the MR images performed on upright and supine positions was estimated using kappa statistics according to Landis and Koch and categorizing the data into different classes. The differences in Modic I changes extent, disc height, and disc degeneration on upright and supine position were compared using the Wilcoxon signed-rank test. Spearman correlation was used to find any relevant associations between Modic changes, Pfirrmann grade, intervertebral disc height, and pain (VAS score).
The software used for statistical analysis was MedCalc (version 17.9.7, MedCalc software).
Modic I changes were present at the level of L5–S1 in 21 patients (55.3%), L4–L5 in 13 (34.2%), and L3–L4 in 4 (10.5%). No patients showed Modic I changes in more than one level.
Interobserver agreement was excellent for both readers, with kappa values ranging from 0.92 to 1, 0.84 to 0.91, and 0.83 to 1, for MC type I, Pfirrmann grade, and intervertebral disc height, respectively. Intraobserver agreement ranged from moderate to excellent, with kappa values ranging for the same variables from 0.61 to 0.88, 0.63 to 0.82, and 0.65 to 0.85, respectively.
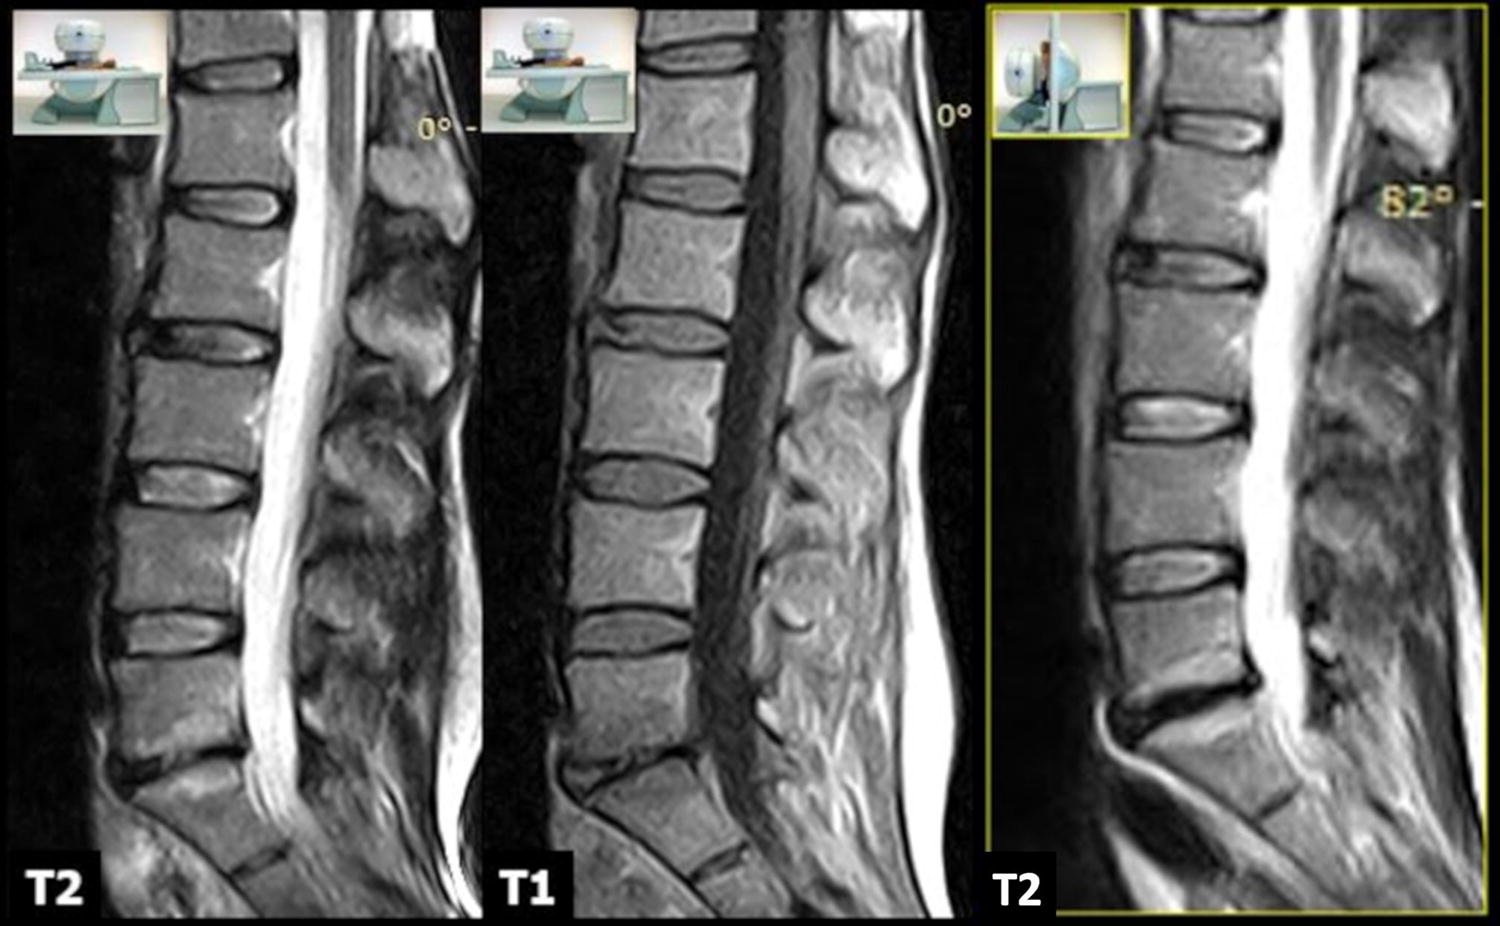
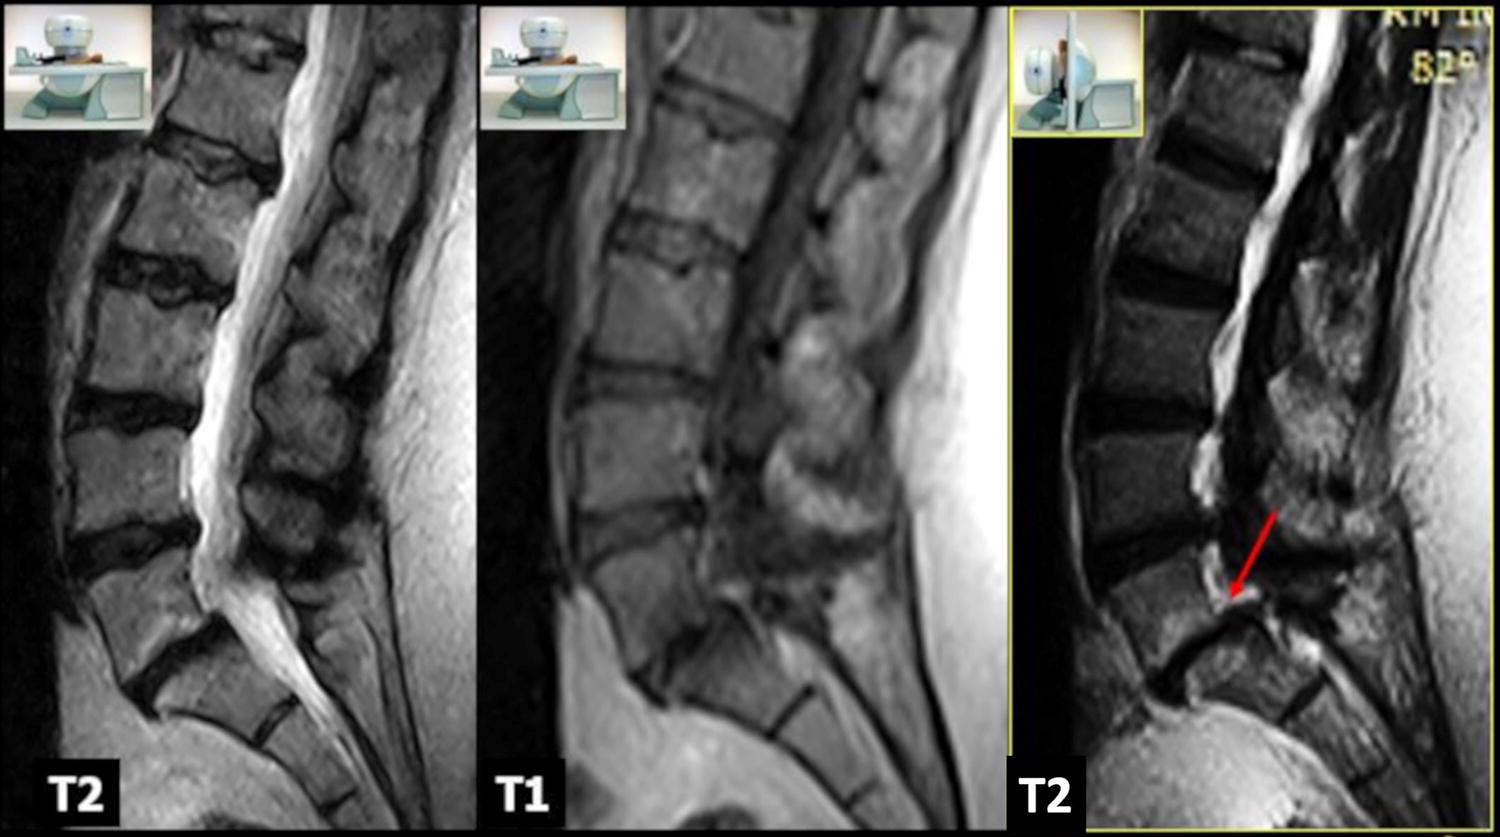
In the supine position, overall mean Modic I changes area was 153.7 ± 41.5 mm2 (range 90.3–231.8). In the upright position, the area of Modic I changes increased in 26 patients (68.4%) (Figs. 2, 3), with an overall mean area of 177.9 ± 53.9 mm2 (range 96.1–270.7). Statistical analysis revealed a significant difference between the two values (p < 0.001) (Fig. 4). We find only two reductions in Modic I changes, and one of them was not clinically significant.
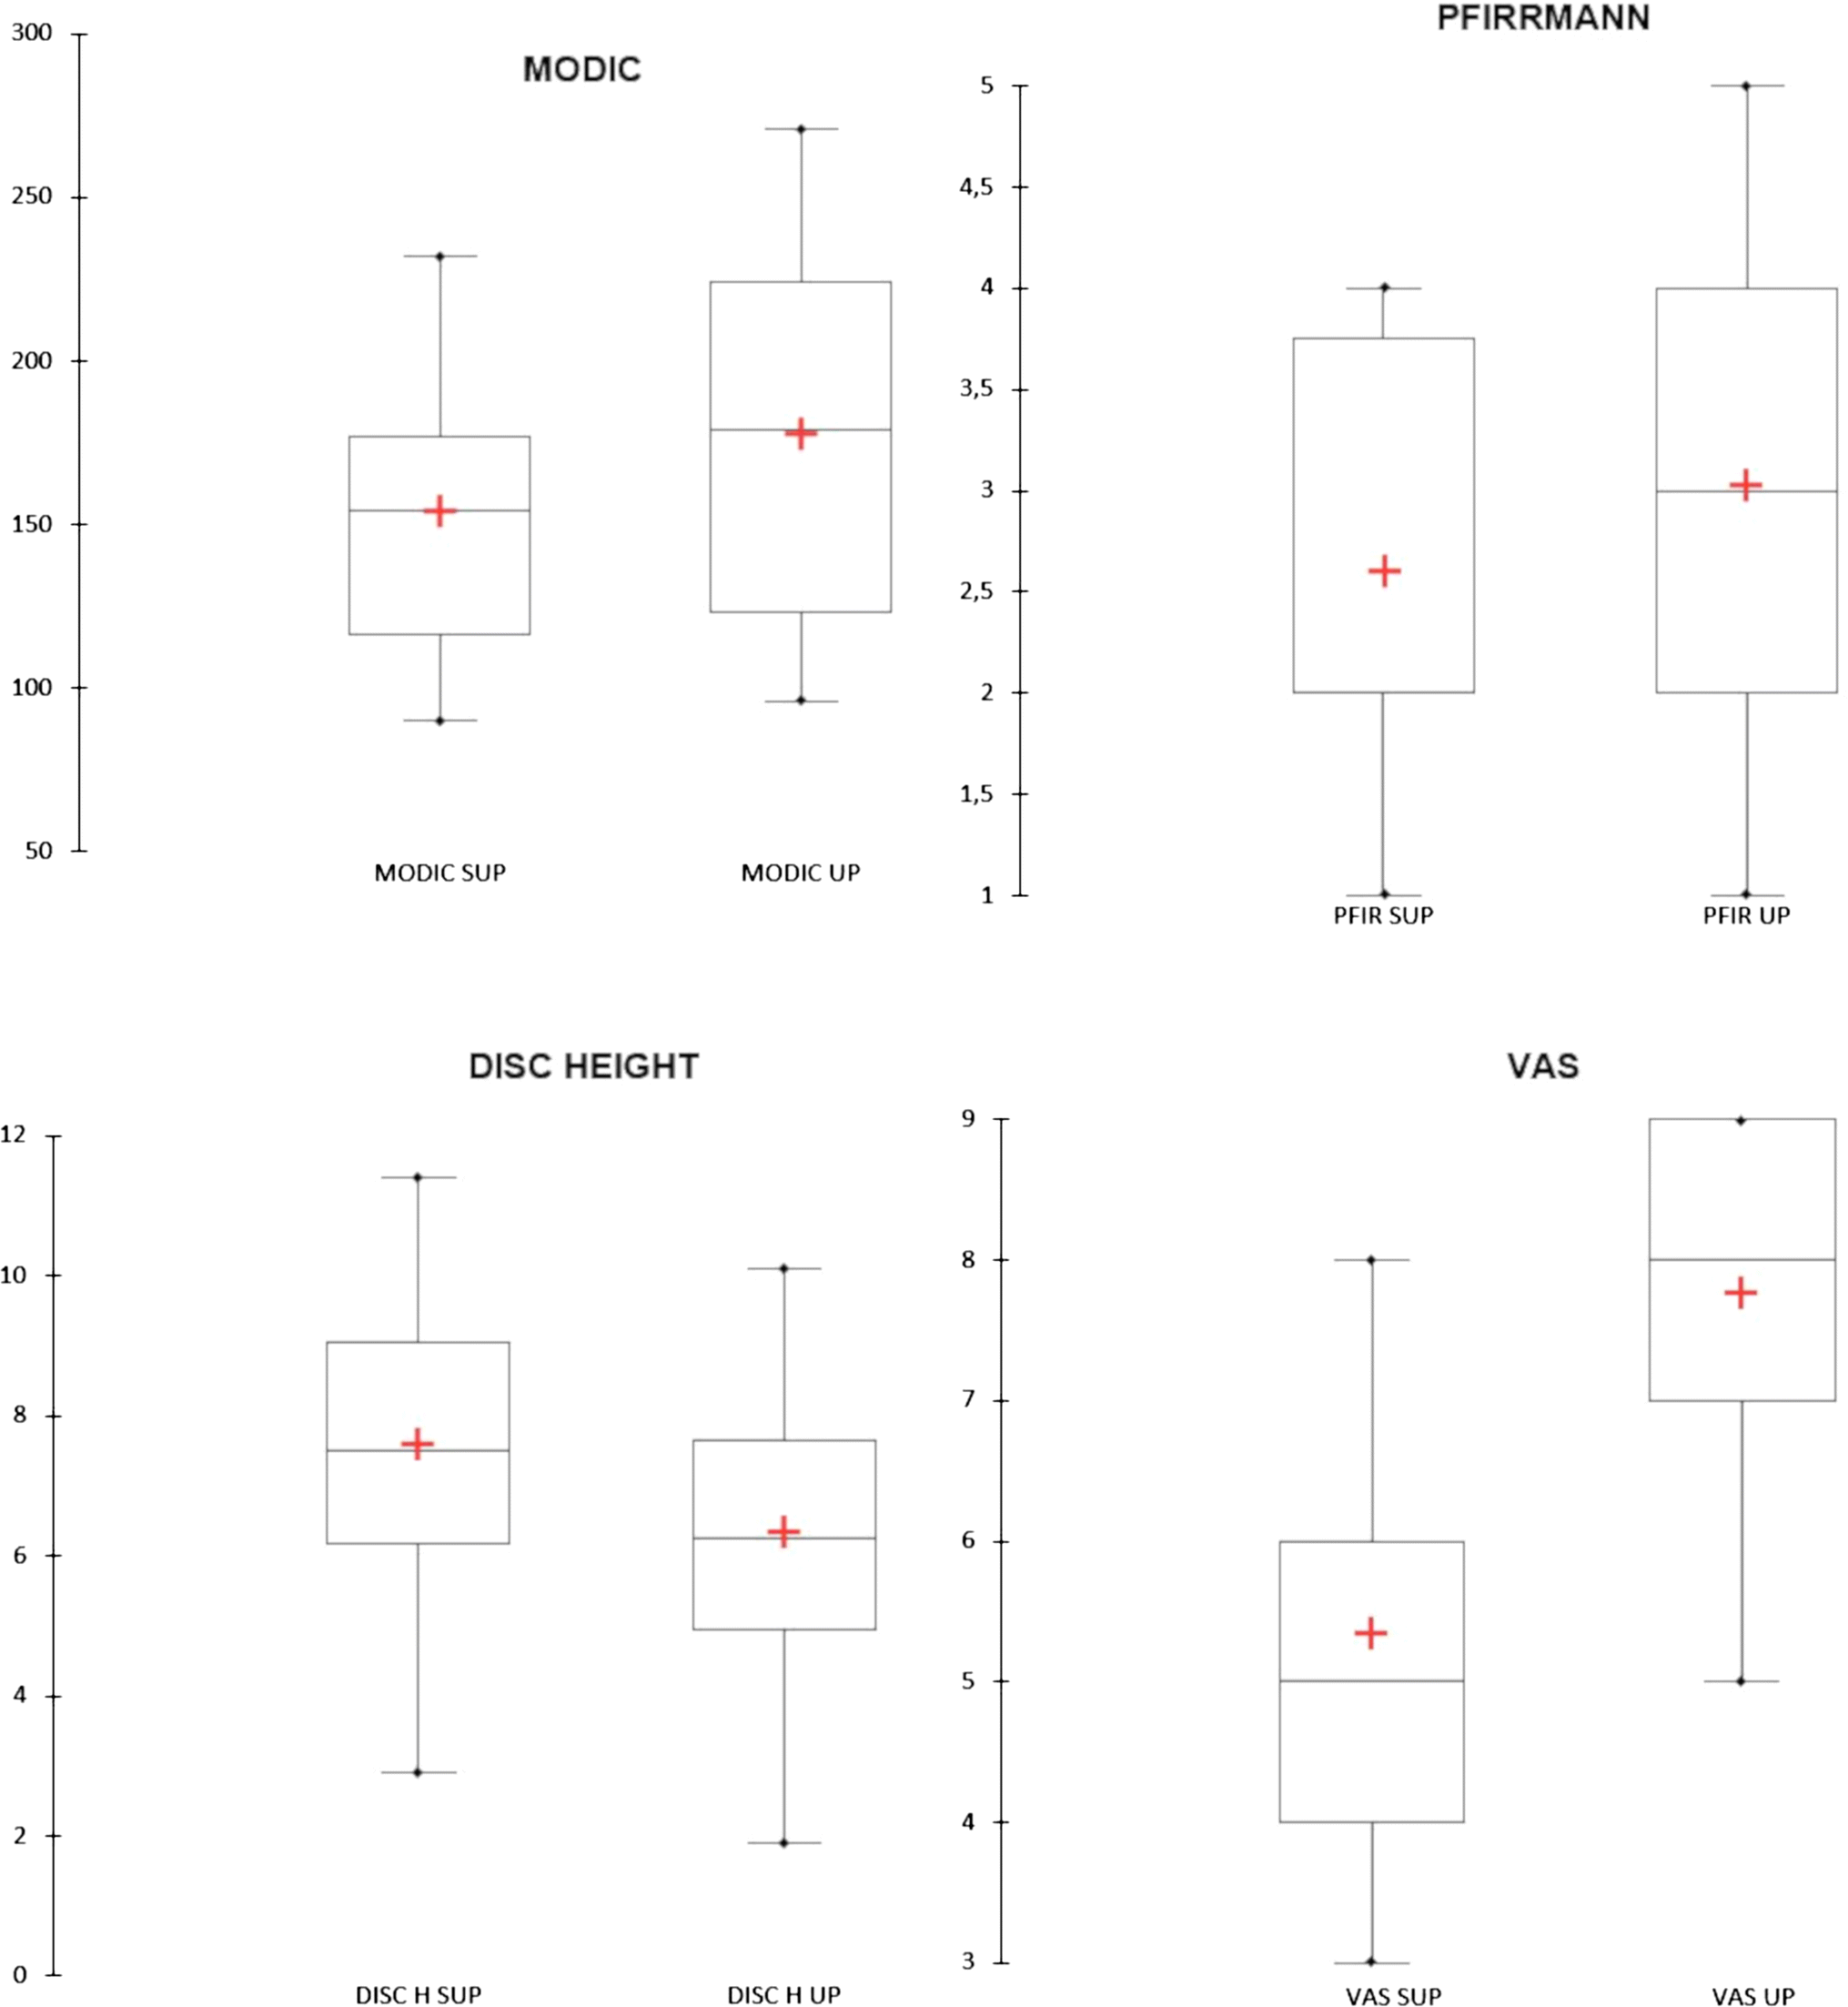
The mean disc height values on the supine position ranged from a minimum of 2.9 mm to a maximum of 11.4 mm (mean 7.5 ± 1.9 mm). In the upright position, we observed a reduction in the disc height in 35 patients (92.1%), with mean intervertebral disc height of 6.33 mm (range 1.9–10.1). Changes in disc height were also statistically significant (p < 0.0001). Increased disc height was not found in any patient.
In the supine position, 5 patients showed Pfirrmann grade I, 15 grade II, 8 grade III, and 10 grade IV. In the upright position, 4 patients showed grade I, 9 grade II, 13 grade III, 6 grade IV, and 6 grade V. Changes in disc degeneration were statistically significant (p < 0.0001).
Correlation analysis showed moderate negative correlation (ρ = –0.45, p = 0.004) between intervertebral disc height variations and increase in the area of Modic I changes, and weak positive correlation (ρ = 0.12, p < 0.001) between Pfirrmann grade and increase in the area of Modic I changes. Increase in VAS values on the upright position correlated significantly (ρ = 0.34, p = 0.036) with the increase in the area of Modic I changes, while no significant correlation was observed between pain and disc height, and degree of degeneration changes.The obtained results are summarized in Table 2, where the median in the supine, upright positions and their Hodges–Lehmann median difference with the 95% confidence interval and the relative statistical significance are shown.Table 2
Median in the supine, upright positions, their Hodges–Lehmann median difference with the 95% confidence interval and the relative statistical significance
| SUP median (IQR) | UP median (IQR) | Hodges–Lehmann median difference (95% CI) | pvalue | |
|---|---|---|---|---|
| MODIC | 154.2 (116.0–177.5) | 178.8 (122.5–228.1) | 22.4 (16.9–30.8) | p < 0.001 |
| DISC | 7.5 (6.1–9.1) | 6.3 (4.9–7.8) | − 1.2 (−1.5 to −0.95) | p < 0.001 |
| PFIR | 2 (2–4) | 3 (2–4) | 0.5 (0–0.5) | p = 0.0004 |
Worsening of low back pain was reported by 30 patients (78.9%) standing on the upright position, with mean VAS values of 5.3 on the standard supine position and 7.8 on weight-bearing position (p < 0.001). Out of these patients, 22 (73.3%) showed an increase in Modic I changes extension.
Results for individual patients are shown in Table 1, and the average results are compared in Fig. 4.
In order to verify the statistical reliability of the relationship between the Modic I extension and the pain increase, the odds ratio (OR) was calculated, obtaining OR 2.75 with a 95% confidence interval ranging from 0.55 to 13.69 (p = 0.218). Although events seemed to suggest a link between Modic increment and pain worsening, the OR does not show a statistical significance indeed.
The differences encountered from patient to patient on MRI findings may give rise to diagnostic problems in determining the exact cause of pain [15, 16, 17, 18, 19], especially in the absence of clear evidence of disc herniation, root compression, or posterior elements involvement. Data from the literature suggest that as many as 80% of patients complaining of low back pain are categorized as having “non-specific low back pain” [9]. The concept of “active discopathy” is closely related to the subset of patients having non-specific low back pain. From an imaging-based as well as histopathological point of view, active discopathy is characterized by the presence of intervertebral disc changes and adjacent vertebral endplate subchondral bone changes associated with degenerative disc disease (Modic changes type I) [20]. The vertebral body endplates are indeed considered the most vulnerable structure functional spinal unit [21]. They have a bony component and a hyaline cartilaginous component. The bony endplate provides mechanical strength preserving a high intradiscal pressure [22], whereas the cartilage endplate is more of a biological barrier to reduce transport (of water, inflammatory agents, bacteria, and so forth) between the trabecular bone of the vertebral body and the fibrocartilage of the intervertebral disc [23, 24]. However, these components have to be considered as a single biomechanical unit [25, 26, 27]. Several grading systems have been proposed to describe and classify disc and endplate degeneration. The most popular MRI grading system for degenerative disc disease was defined by Pfirrmann et al. [28]. The grading system for bone marrow changes near the endplate was implemented by Modic et al. who gave MRI definitions of such alterations [8, 20, 29]. The etiopathogenesis of Modic changes type I is still a matter of debate [20, 30, 31].
According to the theory of “biomechanical stress,” shear, compressive, and bending forces acting on the vertebral endplate adjacent to a degenerated disc lead to endplate microtrauma and subsequent bone marrow oedema [32]. The presence of endplate fissuring and fibrovascular marrow changes has also been confirmed by histopathological studies, supporting this etiopathogenetic theory [20, 32, 33, 34]. According to this model, Modic changes represent a biomechanical alteration of the normal intervertebral environment associated with endplate damage [27]. In particular, cracks and fissures in both cartilaginous endplates of a disc simultaneously lead to internal disc degeneration and disruption [34, 35, 36]. Imaging-based evidence of this pathophysiological cascade was presented by Muftuler et al. [37] who carried out a contrast-enhanced MRI study to investigate endplate dynamics in degenerated discs. He described increased contrast agent accumulation in severely degenerated discs, which provided evidence of disruption of the endplate integrity at later stages of disc degeneration. Another recent work by Rade et al. also reported a strong association between endplate defects and disc degeneration [38]. These findings are in line with previous studies investigating the structural changes in subchondral bone associated with disc degeneration and describing the presence of significant fissures in subchondral bones close to degenerated discs; in particular, a recent study revealed the presence of increased porosity in great detail using µCT [39]. Another mechanical, histological, and micro-CT study of cadaver spines from Zehra et al. [40] confirmed a stronger association between disc degeneration and large or multiple endplate defects.
The development of endplate cracks and fissures, with consequent increase in subchondral bone marrow porosity, may lead to increased inflow, resulting in higher contrast agent accumulation in the cartilaginous endplate during DCE-MRI acquisition. On the other hand, such disruptions may contribute to the formation of a leaky endplate interface, leading to overall loss of hydration and matrix proteins [37]. We support the view that under sustained load, endplate fissuring may provoke redistribution of water from the reduced and dehydrated disc to the adjacent subchondral bone, leading to marrow oedema and pain, the latter depending on the increased pressure on the marrow.
Using a dedicated MRI unit with a table tilt system, we performed an “in vivo” evaluation of the effects of loading on the discovertebral unit.
According to the literature, the primary consequence of disc degeneration under biomechanical stress is the production of pro-inflammatory soluble mediators such as interleukin 6 and prostaglandin E2 in the nucleus pulposus that, diffusing through vertebral endplate and subchondral bone, can generate local inflammation and oedema [41]. It is well known that biomechanically induced local inflammatory changes are a source of pain. Several clinical studies reveal that surgical stabilization may accelerate Modic I changes and contribute to pain relief. Furthermore, treatment with intradiscal steroid injections was found to be effective in pain reduction and regression of Modic I changes. Altogether, these data support the role of biomechanically and/or biochemically induced local inflammation in the pathogenesis of Modic I changes and related symptoms [1].
Some authors suggest that Modic changes be the consequence of local anaerobic infection since the environment surrounding disc herniation and annulus fibrosus disruption is favourable to anaerobic germ growth. This theory is supported by the evidence of positive anaerobic culture from surgically harvested disc herniation tissue [41]. The cascade of inflammatory mediators and superimposed low-grade infection, however, is not exclusive of Modic I changes [32].
Among the Modic endplate changes, MC type I are the most frequently associated with low back pain, but, despite the long debate, the exact relationship remains controversial. Several authors define Modic changes as specific indicators of “discogenic” low back pain with a strong association, while others say that Modic changes are also prevalent in the asymptomatic population [1, 35].
Our results are in line with earlier studies, which suggest that MC type I are associated with low back pain [2]. However, there are indeed other explanations for pain, among which is the reduction in intervertebral space under loading. Disc height reduction is known to affect the size of the foraminal spaces and axial load redistribution to the posterior elements, mainly the facet joints, which cause severe pain due to their innervation. In the present study, we did not evaluate facet joints, spondylolisthesis, or instability, because only sagittal slices were obtained for the follow-up MRI. In previous studies; however, we evaluated the role of weight-bearing MRI in demonstrating “dynamic” joint pathologies, often unmasked by loading [42, 43, 44].
The clinical relevance of MRI of Modic I changes lies in the increasing acceptance of discogenic pain as a cause of low back pain [45]. Moreover, the natural history of Modic signal changes and associated clinical findings suggest that the treatments able to accelerate the switch to Modic 0 or Modic 2 changes may find a role in the therapeutic planning (surgery, intradiscal steroid, bisphosphonates, exercise, and so forth) [41]. To our knowledge, this is the first study that focuses on the effects of loading on endplate changes. Our study has some limitations: first of all, low back pain is a subjective symptom with multifactorial aetiology. In our analysis, we excluded patients with MR evidence of possible low back pain sources different from Modic I changes, such as facet joint pathology. However, the possible presence of low back pain from other causes not evident at MRI (for example, muscular origin) might not be excluded. In the present study, we also excluded patients with disc extrusion, considered as a confounding factor evaluating low back pain source; indeed, there is evidence that endplate disruption and Modic I changes are closely associated with disc herniation [24]. Disc extrusion appears to be also an important factor allowing disc infection [23]. Another limitation of this study is represented by the low number of patients enrolled; nevertheless, our MRI protocol has proved to be sensitive in detecting MR findings of possible pain sources, not readily evident on standard MRI scans. Lastly, our results lack the evaluation of a control group; comparison with asymptomatic individuals would be interesting, given the evidence of the prevalence of Modic changes also in the asymptomatic population [35].
Our results showed the modifications of Modic I changes under loading, with MRI evidence of increased Modic changes area extent in the upright position. Our findings also showed a correlation between Modic changes extension increase and increase in pain from the supine to the standing position. From the clinical point of view, upright scans under physiological load may represent a valid complement to standard sequences, being able to provide additional diagnostic information significant for the treatments of pain due to “active discopathy” in the presence of Modic I changes.
The authors thank Dr. Angela Martella for the language revision and Dr. Nadia Catallo for the statistical revision of the manuscript.
The authors certify that they have no affiliations with or involvement in any organization or entity with any financial interest, or non-financial interest in the subject matter or materials discussed in this manuscript.
Springer Nature remains neutral with regard to jurisdictional claims in published maps and institutional affiliations.
586_2019_5974_MOESM1_ESM.pptx (816 kb)Supplementary material 1 (PPTX 815 kb)
© The Author(s) 2019
Open AccessThis article is distributed under the terms of the Creative Commons Attribution 4.0 International License (http://creativecommons.org/licenses/by/4.0/), which permits unrestricted use, distribution, and reproduction in any medium, provided you give appropriate credit to the original author(s) and the source, provide a link to the Creative Commons license, and indicate if changes were made.