Hermansen, E., Austevoll, I.M., Hellum, C. et al. Comparable increases in dural sac area after three different posterior decompression techniques for lumbar spinal stenosis: radiological results from a randomized controlled trial in the NORDSTEN study. Eur Spine J 29, 2254–2261 (2020). https://doi.org/10.1007/s00586-020-06499-0
To investigate changes in dural sac area after three different posterior decompression techniques in patients undergoing surgery for lumbar spinal stenosis.
Decompression of the nerve roots is the main surgical treatment for lumbar spinal stenosis. The aim of this study was to radiologically investigate three commonly used posterior decompression techniques.
The present study reports data from one of two multicenter randomized trials included in the NORDSTEN study. In the present trial, involving 437 patients undergoing surgery, we report radiological results after three different midline retaining posterior decompression techniques: unilateral laminotomy with crossover (UL) (n = 146), bilateral laminotomy (BL) (n = 142) and spinous process osteotomy (SPO) (n = 149). MRI was performed before and three months after surgery. The increase in dural sac area and Schizas grade at the most stenotic level was evaluated. Three different predefined surgical indicators of substantial decompression were used: (1) postoperative dural sac area of > 100 mm2, (2) increase in the dural sac area of at least 50% and (3) postoperative Schizas grade A or B.
No differences between the three surgical groups were found in the mean increase in dural sac area. Mean values were 66.0 (SD 41.5) mm2 in the UL-group, 71.9 (SD 37.1) mm2 in the BL-group and 68.1 (SD 41.0) mm2 in the SPO-group (p = 0.49). No differences in the three predefined surgical outcomes between the three groups were found.
For patients with lumbar spinal stenosis, the three different surgical techniques provided the same increase in dural sac area.
The study is registered at ClinicalTrials.gov reference on November 22th 2013 under the identifier NCT02007083.
Lumbar spinal stenosis (LSS) is a clinical and radiological entity with symptoms predominantly in the lower extremities, including reduced walking capability, neurogenic claudication and sometimes radicular pain. Symptoms are associated with narrowing of the spinal canal [1] due to degenerative (spondylotic) changes, described as bulging of the intervertebral disc and hypertrophy of the facet joints and ligaments. The goal of surgery is to decompress the nervous and vascular tissue in the spinal canal, and decompressive surgery is now the most frequently performed surgical procedure in the adult lumbar spine [2].
A total laminectomy was considered the gold standard by many surgeons [2]. A meta-analysis after laminectomy showed success rates as low as 64% [3] and alternative mid-line retaining techniques have been introduced to improve the results. In the past decade, mid-line retaining decompression techniques such as unilateral laminotomy with crossover (UL), bilateral laminotomy (BL) and spinous process osteotomy and decompression (SPO) have become commonly used surgical methods [2]. However, there is no consensus or scientific evidence [4,5,6] suggesting that any one of these techniques yields superior clinical results compared to the others.
An objective way to quantify the surgical decompression achieved by the different posterior decompression techniques is to measure the increase in dural sac area at the most stenotic level after surgery [7]. It is unclear whether one technique gives a greater increase in dural sac area over another. Furthermore, it is unknown whether a wide decompression offers better clinical results than a less extensive decompression technique.
The aim of the present study was to quantify and compare the increase in dural sac area and Schizas grade achieved by three different posterior decompression techniques: UL, BL and SPO.
Data were collected as part of the NORwegian Degenerative spondylolisthesis and spinal STENosis (NORDSTEN) study, a multicenter study with 17 participating Norwegian hospitals. NORDSTEN consists of the Spinal Stenosis Trial (SST), Degenerative Spondylolisthesis Trial (DST) and the Observational Cohort (OC). In the present study, we included patients from the SST cohort.
The main objective of the SST has been published in the study protocol [8], but the present study focuses on the radiological results after the three posterior decompression techniques: UL, BL and SPO.
Eligible patients had been referred to an orthopedic or neurosurgical outpatient clinic for lumbar spinal stenosis symptoms and corresponding magnetic resonance imaging (MRl) findings, between March 2014 and October 2018. Patients with degenerative spondylolisthesis were excluded. Only those fulfilling all eligibility criteria (Table 1) were included. The presence of foraminal stenosis was not an exclusion criterion.Table 1 Inclusion and exclusion criteria for the Spinal Stenosis Trial (SST) in the NORDSTEN studyFull size table
After signing the informed consent form, patients were randomized to one of the three different posterior decompression techniques. The randomization (1:1:1 allocation) was performed within the 6 weeks before surgery. We used a randomized block design, stratified by hospital, with the blocks being made as small as possible. The randomization procedure was concealed (computer generated) and administered by the NORDSTEN study coordination center at a university hospital (Communication and Research Unit for Musculoskeletal Health (FORMI), Oslo University Hospital Oslo, Norway). Further, the allocation was communicated to the local research coordinator who was not involved in the recruitment or treatment of patients.
All surgeons were familiar with the three techniques through previous experience, the surgical protocol, and joint demonstration operations. Figure 1 illustrates the three techniques. In all techniques, the actual level was confirmed by intraoperative fluoroscope. When performing unilateral laminotomy with crossover, loupe magnification or microscopy was mandatory, while in bilateral laminotomy and spinous process osteotomy loupe magnification or microscopy could be used, depending on the surgeon’s preference. We considered it important to visualize the respective medial borders of the pedicles and the nerve roots, from the beginning of the thecal sac passing the pedicle.
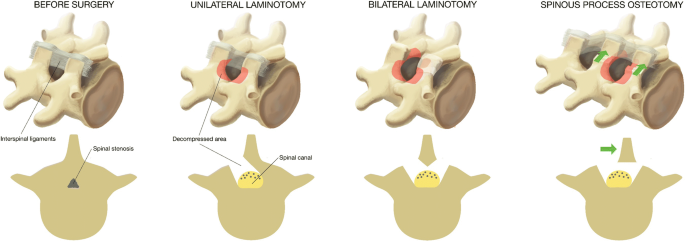
Unilateral laminotomy with crossover (UL): The decompression was initiated by ipsilateral flavectomy, followed by a laminotomy of the lower part of the superior lamina and the upper part of the inferior lamina. Laterally, a medial facetectomy was performed and the patient was then slightly rotated in order to visualize the contralateral side. The dura was retracted, and the decompression was performed contralaterally.
Bilateral laminotomy (BL): The decompression of the spinal canal was initiated by a bilateral flavectomy followed by a bilateral laminotomy of the lower part of the superior lamina and the upper part of the inferior lamina. Laterally, a medial facetectomy was performed.
Spinous process osteotomy and decompression (SPO): An osteotomy was performed at the base of the spinous process above (and sometimes below) the affected level. The spinous process(es) were retracted to the contralateral side with intact supraspinal and interspinal ligaments, giving a midline access to the spinal canal. The decompression was first performed in the midline, then laterally at both sides. A laminotomy of the lower part of the superior lamina and the upper part of the inferior lamina was performed, followed by a medial facetectomy. Both nerve roots were visualized, and the lateral recesses were decompressed. Special attention was warranted when a multilevel decompression was performed in order to retain at least 1/3 of the lamina.
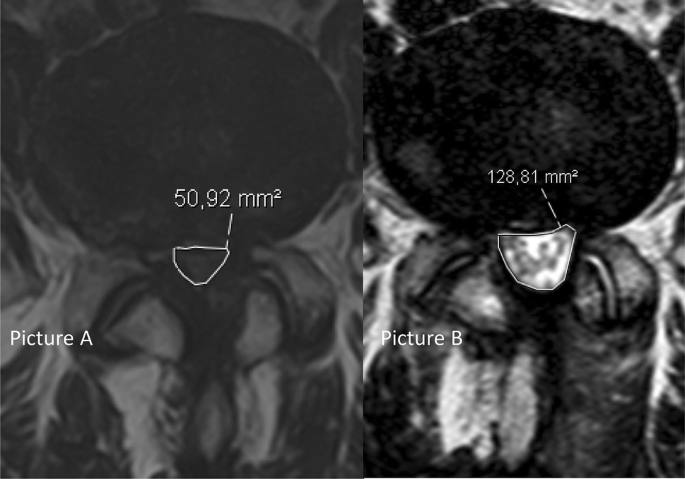
All patients had an MRI of the lumbosacral region within the six months preceding, and at three months after, surgery. All radiological images were imported into a Picture and Archiving System (PACS), Sectra Sweden, IDS7. The measurements were performed by all investigators, using the integrated software tools for area measurements included in the PACS-system. All MRI examinations included axial and sagittal T2-weighted and sagittal T1-weighted images. Dural sac area (Fig. 2) was measured in mm2 before and after surgery by a minimum of three readers (two orthopedic surgeons and one radiologist), who were blinded as to the group allocation. Three levels (L2–L5) were evaluated. The smallest area at disc level, in the most stenotic level (index level), was noted. The numeric increase from baseline of mm2 in dural sac area and the percentage increase from baseline were measured at the index level after surgery, and the mean values of all the readers’ measurements were recorded for each index level. Schizas grade was also noted for the same levels. Schizas grading system is a morphologic grading system from A–D to determine the severity of lumbar spinal stenosis [9]. In cases of disagreement between the readers in the Schizas grading, a simple majority decided the correct grade, through a consensus meeting.
Three different predefined surgical indicators of substantial decompression were chosen, i.e., the proportion of patients achieving (1) a postoperative dural sac area of > 100 mm2 (based on previous reports defining a central stenosis as less than 70–100 mm2 [10,11,12,13]), (2) an increase in the dural sac area of at least 50% and (3) a postoperative Schizas grade A or B.
The area measurements and Schizas categories performed for the first 108 cases were included in intra- and inter-observer reliability assessments. Four readers (two orthopedic surgeons and two radiologists) performed the radiological evaluations twice, with a retest interval of at least 6 weeks.
All statistical analyses were performed using Stata (StataCorp. 2017. Stata Statistical Software: Release 15. College Station, TX: StataCorp LLC.). Comparing dural sac areas between treatment groups was performed using an ANOVA test, supplemented with post hoc pairwise tests if the overall ANOVA test was significant. The proportions of patients reaching surgical goals were compared using standard chi-square tests.
To investigate inter-observer and test–retest reliability of the area measurements, intraclass correlation coefficient (ICC), mean difference with corresponding Limits of agreement (LOA), as well as the smallest detectable change (SDC) were calculated. The LOA was determined as the overall mean difference ± 1.96 times the square root of the overall variance, where the overall mean and overall variance are calculated from the means and variances of measurements for all pairs of readers (4 readers, 6 pairs). SDC was calculated using the formula SDC = 1.96*sqrt (2)*SEM, where SEM–the standard error of measurement, is given by the square root of the error variance of the ICC. The ICC was calculated with a two-way mixed effects model for absolute agreement. Gwet’s agreement coefficient (AC1) was calculated for the Schizas grading system [14].
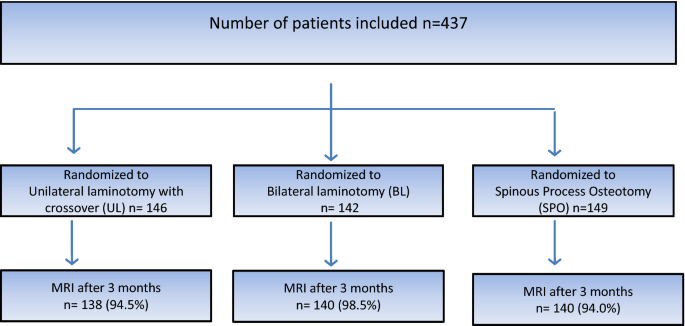
A total of 437 patients were included in the trial: 146 in the UL-group, 142 in the BL-group and 149 in the SPO-group. The mean number of levels operated upon was 1.43 in all three groups. The patient flow chart is presented in Fig. 3.
Baseline demographic parameters are presented in Table 2.Table 2 Demographic baseline data for patients included in the trialFull size table
The radiological results are presented in Table 3. Complete measurements at both baseline and at 3 months follow-up were obtained for 89.0% (389/437) of the patients. At baseline, the mean dural sac area in the whole cohort was 51.1 mm2 (SD 21.1). No significant differences between the three groups in preoperative or postoperative dural sac area were found. Schizas grading at baseline indicated that 9.2% (38/413) of the patients were classified as Schizas grade A, 16.9% (70/413) as grade B, 62.7% as grade C (25 9/413) and 11.1% (46/413) as grade D. In the whole cohort, the mean dural sac area increased by 68.6 mm2 (SD 39.9) to a mean area of 120.6 mm2 (SD 46.9) postoperatively. The mean percentage increase from baseline was 158% (SD 119.5). Mean increases for each group are presented in Table 3.Table 3 Preoperative, postoperative, increase in dural sac area given as absolute increase and %-increase from baseline in dural sac area for patient operated with the three different posterior decompression techniquesFull size table
Similar proportions of patients in all three groups reached the surgical goal of substantial decompression as measured by each of the three criteria. The results were as follows: 67.2% of the patients had a postoperative area > 100 mm2, 84.3% had an increase in area of > 50%, and 92.0% had Schizas grade A or B after surgery (Table 4).Table 4 Proportion of patients obtaining substantial decompression defined as a dural sac area > 100 mm2Full size table
Both the inter- and intra-observer agreements for the area measurements were high, with estimated average ICC of 0.90 and 0.97, respectively. The corresponding mean difference (with LOA) and SDC were 5.9 (−29.6–41.5) and 36 for inter-observer agreement and −0.2 (−23.3–22.9) and 23.1 for intra-observer agreement. The inter-observer agreement for the Schizas grading system, measured by Gwet’s agreement coefficient (AC1), was 0.68. For intra-observer agreement, the average AC1 was 0.87.
Among patients undergoing UL, BL or SPO techniques for lumbar spinal stenosis, we found no differences between the groups in mean increase or measurement of actual cross-sectional dural sac area, 3 months after surgery. All three surgical methods gave satisfactory radiological results in a majority of the patients; for example, the cross-sectional area increased by > 50% in over 80% of the patients regardless of the technique used, and there were no differences between the three groups in obtaining substantial decompression as measured radiologically, using the three radiological parameters.
The SST in the NORDSTEN study is a randomized controlled trial, designed with high internal validity. The fact that this is a multicenter trial involving 17 participating hospitals and surgeons familiar with the surgical techniques, increases external validity. The study reflects not only everyday surgical practice in Norway, but also normal practice in many other countries.
The present study is, as far as we know, the largest study to evaluate dural sac area before and after decompressive surgery. The high number of participants and the high follow-up rate, combined with a high inter- and intra-observer agreement for the radiological analysis, make it unlikely that these were incidental findings.
Lumbar spinal stenosis can be located in the central canal, the lateral recess and the foramen. Radiological measurement of the dural sac area before and after surgery reflects mainly the decompression achieved in the central canal and less so for the lateral recesses and foramen. Therefore, it remains to be seen whether the radiological evaluations presented correspond with clinical outcomes in the main survey.
Previous studies concerning dural sac area achieved after surgery have included only small numbers of patients. The postoperative dural sac cross-sectional area measurements obtained in the present study correspond well to the findings of Leonardi et al., who reported postoperative areas of 125 mm2 after partial laminectomy; 123 mm2 after bilateral laminotomy; and 137 mm2 after unilateral laminotomy with crossover, in a group of 30 patients [6].
The increase in dural sac area has a larger variation in other studies. The mean increase in dural sac area for the three groups in the present study was all between 66 and 72 mm2. This may be compared with the findings by Hong et al. in a study including 53 patients. They found a statistically significant difference in dural sac area increase in favor of bilateral laminotomy (153 mm2) vs unilateral laminotomy with crossover (120 mm2) [15]. In another study with fewer patients (n = 18) comparing these two surgical techniques, Dalgic et al. showed no difference between groups and a mean increase in dural sac area of only 42 mm2 [16]. Further, Hermansen et al. found a mean increase in dural sac area of 81 mm2 in a non-comparative study of SPO in 46 patients [5].
The variation in increase in dural sac area in previous studies certainly suggests differences in surgical technique. Our multi-center RCT design ensured training and standardization of surgical techniques before the initiation of the trial, and far more patients were included in each treatment group in the present study compared with previous studies. All three posterior decompression techniques reported in this paper resulted in a substantial and similar dural sac expansion. This indicates that satisfactory surgical decompression of the dural sac can be achieved using any one of the three posterior decompression techniques.
Measurement of the dural sac area in a scientific setting is recommended in a systematic review by Steurer et al. [7]. It is debatable whether a mean increase alone gives adequate information about the radiological results of the techniques. In the present study, we have therefore chosen to define three indicators of substantial decompression. First, the proportion of patients who had achieved a dural sac area of > 100 mm2 after surgery. Schonstrom defined the measurements for absolute lumbar spinal stenosis as a dural sac area of < 70 mm2, and a relative lumbar spinal stenosis as a dural sac area of between 70 and 100 mm2 [13, 17], which has been supported by others [10, 13, 18]. In the systematic review by Steurer et al., it is reported that most authors indicated a central stenosis if the dural sac area was below 100 mm2 [7, 10,11,12,13, 18]. Based on these recommendations, we chose one of the three parameters of substantial decompression as a final dural sac area of > 100 mm2 postoperatively.
The second substantial decompression criterion, which is the percentage increase in the dural sac area, is based on the concept that the preoperative dural sac area has been reported as a predictor of clinical outcome after a posterior decompression [19]. Furthermore, patients with a very narrow dural sac preoperatively can achieve good results, even though the end-point area is not above a specific predefined value.
The third criterion, whether the patients reached a Schizas grade of A or B, is based on the pathophysiological thinking behind this classification; if there is fluid in the dural sac around the nerve filaments, the probability of a symptomatic stenosis is low [9].
The more important research question will be whether the extent of increase in cross-sectional area is associated with the clinical results. Hermansen et al. published a study showing a positive correlation between patient satisfaction (7-point global perceived effect scale) and the extent of increase in dural sac area in 46 patients [5]. However, other trials have not confirmed these findings.
For patients undergoing surgery for LSS using one of three different midline-preserving techniques, we found no difference in the degree of decompression achieved, three months after surgery.
Open Access funding provided by University of Bergen. This trial received funding from Central Norway Regional Health Authority (RHA) and Western Norway Regional Health Authority (RHA). We thank Paul Saunderson, MD, for linguistic assistance in writing the manuscript.
Correspondence to Erland Hermansen.
The authors declare that they have no conflict of interest.
Ethical approval was received from the Norwegian Committee for Medical and Health Research Ethics (2011/2034).
Springer Nature remains neutral with regard to jurisdictional claims in published maps and institutional affiliations.
Open Access This article is licensed under a Creative Commons Attribution 4.0 International License, which permits use, sharing, adaptation, distribution and reproduction in any medium or format, as long as you give appropriate credit to the original author(s) and the source, provide a link to the Creative Commons licence, and indicate if changes were made. The images or other third party material in this article are included in the article's Creative Commons licence, unless indicated otherwise in a credit line to the material. If material is not included in the article's Creative Commons licence and your intended use is not permitted by statutory regulation or exceeds the permitted use, you will need to obtain permission directly from the copyright holder. To view a copy of this licence, visit http://creativecommons.org/licenses/by/4.0/.